Figure 2.
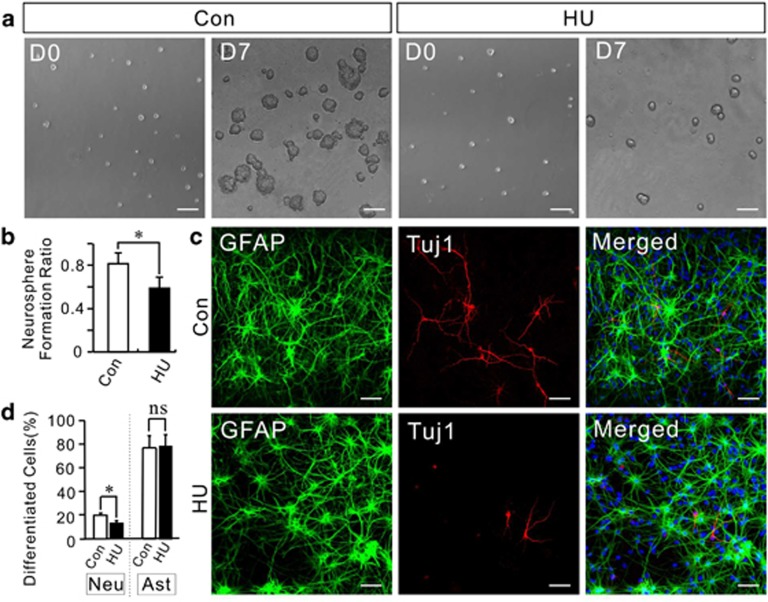
Proliferation and differentiation of HU-treated NSCs. (a) In vitro proliferative capacity of NSCs assayed by colony formation experiment. Representative images of neurospheres from control (Con) and HU-treated (HU) cells. The number of neurospheres formed after 1 week was counted. D0 shows the plated NSCs after single-cell dissociation at day 0. D7 shows the neurosphere formed after 7 days of culturing. Scale bar: 60 μm. (b) Statistics for the ratio of neurosphere formation after 7 days in vitro. Mean±S.E. from three independent experiments. *P<0.05, Student's t-test. (c) In vitro differentiation of neurospheres from control and HU-treated cells as determined by the neuronal marker (Tuj1) and the astrocyte marker (GFAP). Cells showed a decreased proportion of neural progeny in the HU-treated group. Scale bar: 50 μm. (d) Statistics for the percentage of Tuj1+ and GFAP+ cells out of all cells formed from control and HU-treated cells. Ast, astrocyte; Neu, neuron. Mean±S.E. from three independent experiments. *P<0.05, Student's t-test

