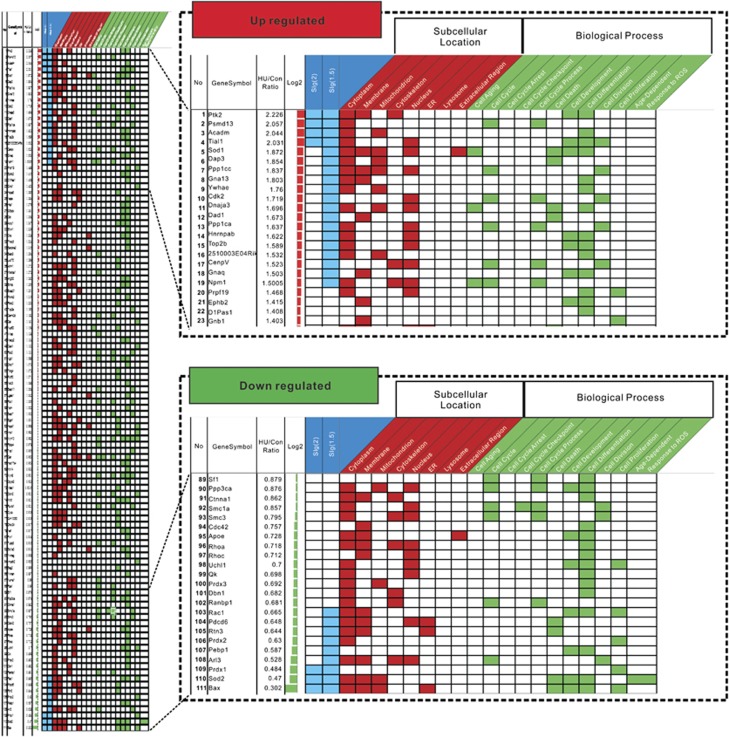
Figure 4.
Heatmap analysis of differentially expressed proteins post HU treatment. The GO information was obtained from Gene Ontology Annotation database. The ratio of protein expression between HU and control groups was presented as log2 values and represented by the lengths of the bar. The red and green bars stand respectively for the upregulated and the downregulated. The subcellular location and biological function of each protein are allocated and indicated respectively by the red- and green-colored spaces

