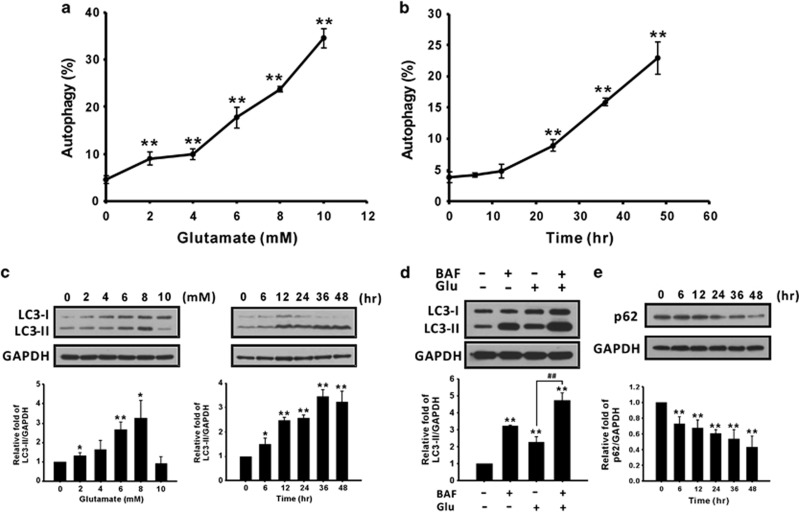
Figure 3.
Glutamate induces autophagy in astrocytes in the dose- and time-dependent manners. (a and b) Cells were treated as described in the legend of Figures 2a and b. The percentages of AVOs were analyzed using flow cytometry with acridine orange staining. (c) CTX TNA2 cell lysates (30 μg/lane) were analyzed using immunoblotting with anti-LC3 and anti-GAPDH antibodies. (d) CTX TNA2 cells were treated with 2 nM BAF and 8 mM glutamate for 24 h, and cell lysates were analyzed using immunoblotting. (e) The p62 protein level was analyzed using immunoblotting. GAPDH was used as an internal control to normalize the amount of proteins applied in each lane. Glu, glutamate. Data are presented as mean±S.E.M. (n=3/group). *P<0.05, **P<0.01 versus the respective control; ##P<0.01 versus the glutamate group, one-way ANOVA

