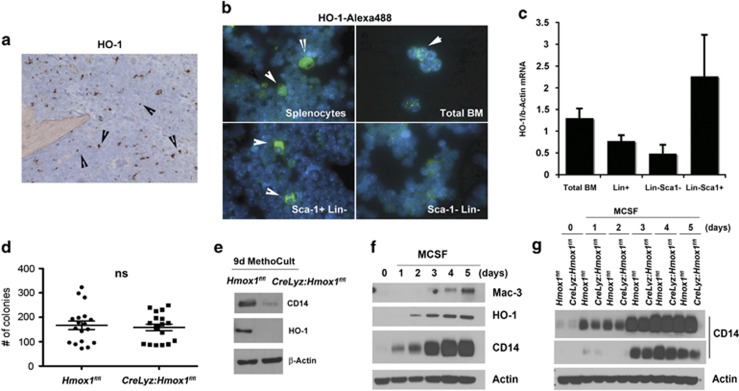
Figure 2.
HO-1 dictates bone marrow differentiation toward macrophage linage. (a) Immunohistochemistry with antibody against HO-1 in bone marrow of wild-type mice. Note the single positive cells in the bone marrow progenitor fraction. (b) Immunofluorescent staining of HO-1 on enriched progenitor cells from the bone marrow in a C57/BL6 mouse. Isolated splenocytes (positive control for HO-1 staining), total bone marrow cells, sca1+/lin- and sca1-/lin- populations were subjected to cytospin and stained with antibody against HO-1. Representative pictures from 2 to 3 experiments are shown. (c) Real time PCR was performed in the cell fractions as in b. HO-1 expression per β-Actin is presented as fold change over total BM levels of HO-1. (d) Total BM cells from Hmox1flfl and CreLyz:Hmox1flfl mice were isolated and cultured in methylcellulose medium for 9 days following manufacturer's protocol. Colony counts in methylcellulose medium were performed on day 9. P>0.05, NS (e). Total BM cells from Hmox1flfl and CreLyz:Hmox1flfl mice were isolated and cultured in methylcellulose medium for 9 days following manufacturer's protocol. Immunoblotting with antibody against CD14 and HO-1 was performed on cell lysates. Data are representative for 2–3 experiments. (f) BM cells were induced toward macrophage differentiation using MCSF (20 ng/ml). Detection of HO-1, Mac3, and CD14 was performed by immunoblotting. Cells were harvested on days 0–5 during differentiation. Data are representative for at least three experiments. (g) BM cells isolated from Hmox1flfl and CreLyz:Hmox1flfl mice were subjected to MCSF-induced differentiation as in f, and the levels of CD14 were measured by immunoblotting. Note that the levels of CD14 are lower in BM from CreLyz:Hmox1flfl mice as early as day 1. Two different exposures of the same CD14 blot are presented to better appreciate the changes in early and later time points

