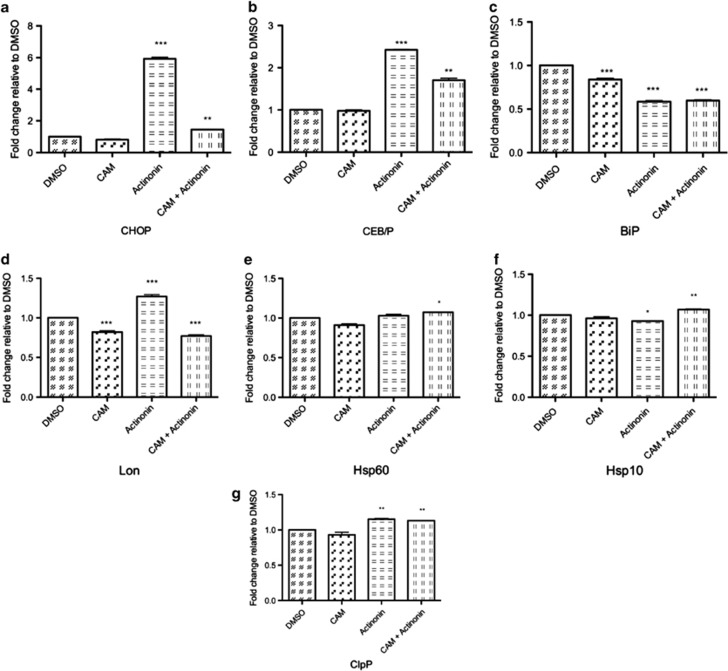
Figure 7.
Inhibition of HsPDF induces mtUPR. mRNA for protein markers of mtUPR was measured by qPCR, normalized to B-actin and then represented relative to DMSO vehicle control in Ramos Cells. Actinonin=15 μM, CAM=100 μM, CAM was added to pretreated cells for 2 h before the addition of actinonin. All measurements were taken at 4 h post treatment (6 h post pretreatment). (a) CHOP message was upregulated sixfold relative to vehicle control and reduced by pretreatment of CAM. (b) CEB/P was upregulated 2.5-fold relative to vehicle control and is reduced by pretreatment with CAM. (c) BiP, a marker of ER stress is reduced after treatment with actinonin and unchanged by CAM pretreatment. (d) Mitochondrial protease Lon is upregulated on treatment with actinonin, and reduced by pretreatment with CAM. There is no change after addition of actinonin or pretreatment with CAM in chaperones Hsp60 (e), Hsp10 (f) and the protease ClpP (g). *P<0.05; **P<0.01; ***P<0.001

