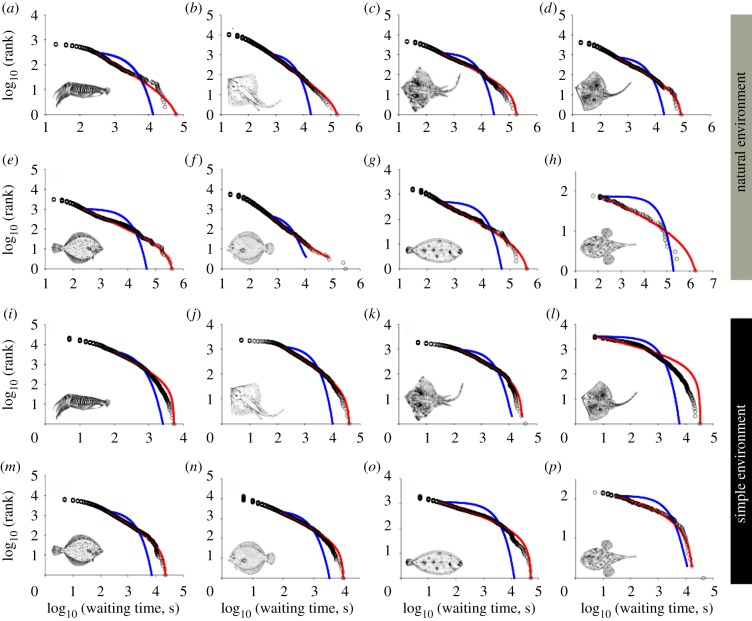
Figure 2.
Power-law scaling of waiting time distributions among individuals of diverse species. Example log–log plots show model best fits to truncated power-law (red lines) and poor fits to an exponential (blue lines) for eight individuals from species tracked both (a–h) in the wild and (i–p) in captivity. (a,i) Common cuttlefish, (b,j) small-eyed ray, (c,k) thornback ray, (d,l) blonde ray, (e,m) European plaice, (f,n) turbot, (g,o) common sole and (h,p) anglerfish.

