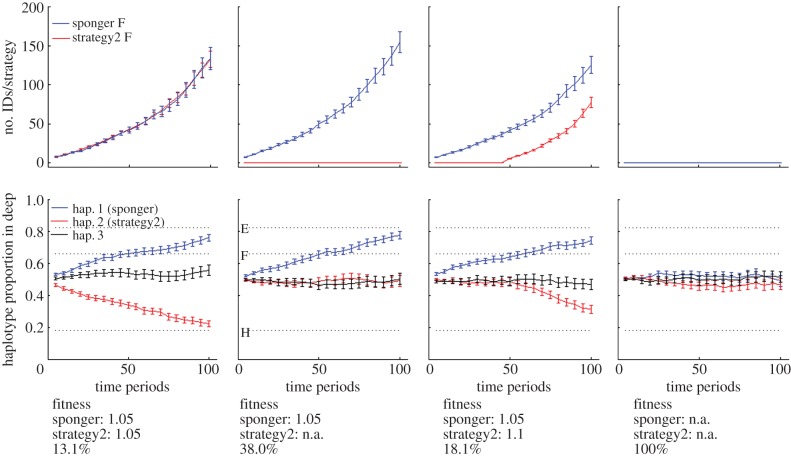
Figure 3.
mtDNA haplotype segregation by habitat in an individual-based model. Three mtDNA haplotypes (hap.1, 2 and 3) and two habitat specializations (sponging and strategy2) were present. All spongers had hap.1 and all strategy2 individuals had hap.2. Top row: number of different females per strategy (no. IDs/strategy). Bottom row: proportion of individuals with a particular mtDNA haplotype in deep water relative to all individuals with this particular mtDNA haplotype. Proportions were calculated for every haplotype separately. Error bars represent 1 s.e. Dashed lines indicate the observed haplotype proportion in deep water for the three mtDNA haplotypes E, F and H in WSB. Fitness benefits for specialists are shown below graphs. Because random cultural drift [41] is a strong force counteracting the establishment of new innovations, we indicated the likelihood (%) of at least one specialist/strategy to persist for 100 time periods; this is shown below the fitness benefits. Learning fidelities equalled 1 for daughters born to specialists for the simulations shown here. Simulation results with various other learning fidelities and fitness benefits are shown in the electronic supplementary material, figure S3. In the first column, individuals of both strategies had the same fitness benefits. In the second column, only one strategy (sponging) was present, in the third column, strategy2 was innovated 50 time periods after sponging and had a higher fitness, and in the fourth column, there were no specializations present.

