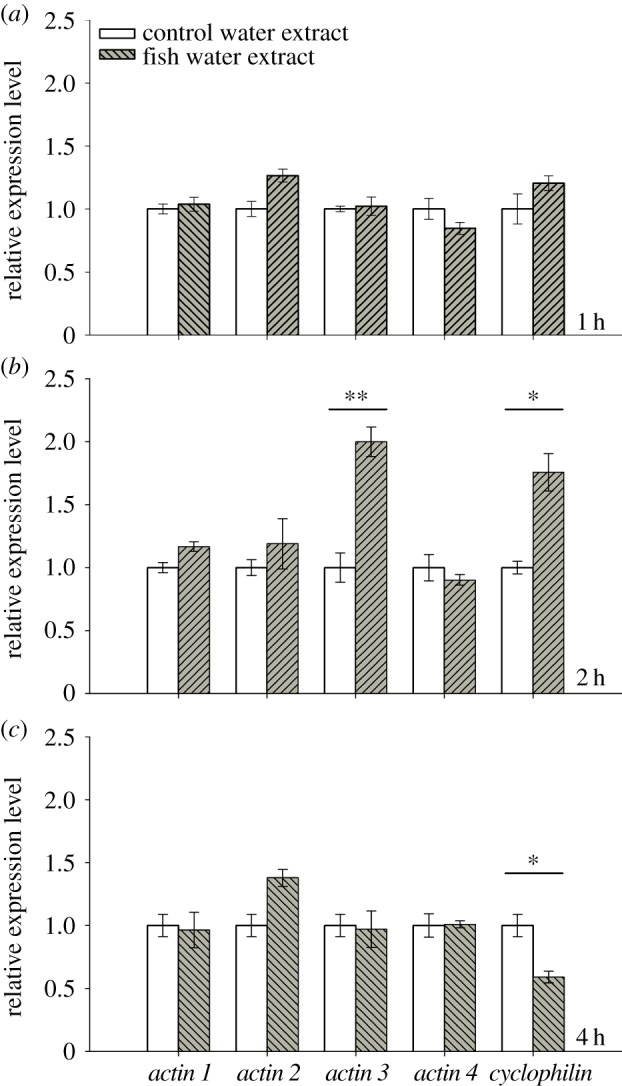
Figure 2.

Mean relative expression of candidate genes in Daphnia magna. The expression pattern of the candidate genes actin 1–4 and cyclophilin (n = 3, mean ± s.e.) was determined 1, 2 and 4 h after exposure to extract of control water (open bars) or to fish incubation water (filled bars). Asterisks indicate a significant difference between control and kairomones (*p < 0.05; **p < 0.01). (Online version in colour.)
