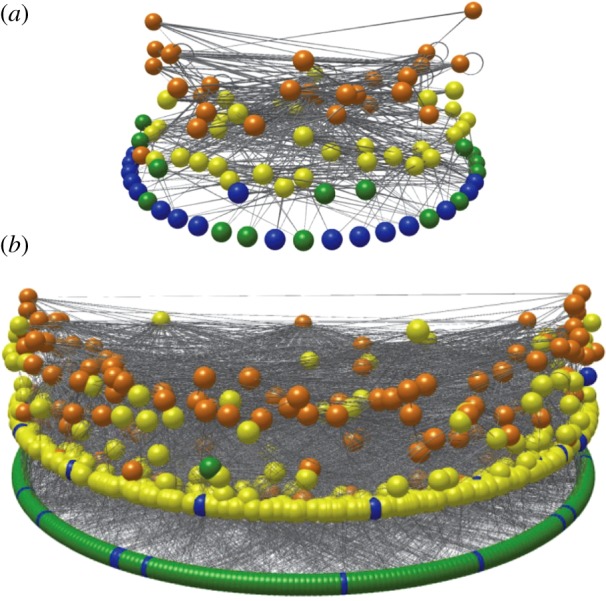
Figure 1.

Visualizations of the Messel lake and forest food webs. (a) Lake food web and (b) forest food web. Spheres represent taxa, lines represent feeding links. Links that loop indicate cannibalism. The vertical axis corresponds to short-weighted trophic level [48], with autotrophic taxa and detritus at the bottom level. Images produced with Network3D [49,50]. Colours of nodes correspond to taxonomic affiliation of species. Green, plants, including algae and diatoms; blue, bacteria, fungi and detritus; yellow, invertebrates; orange, vertebrates.
