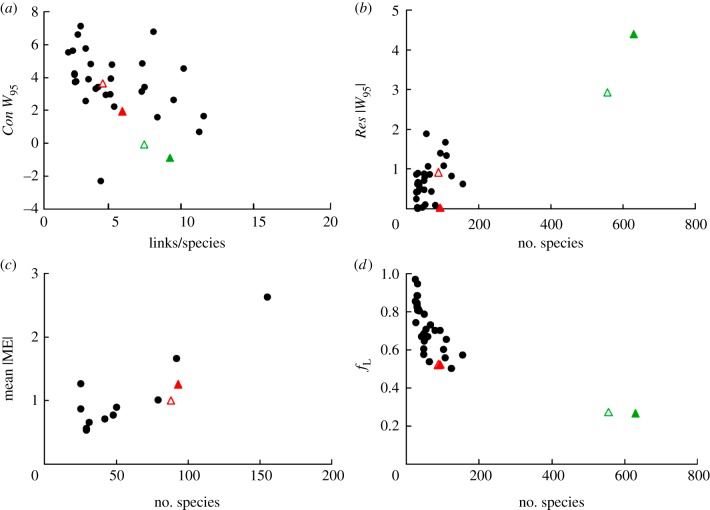
Figure 2.
Scale dependence of MaxEnt, niche model and PNM results. (a) Relative width of the empirical consumer distributions (Con W95) plotted against link density (L/S). (b) Absolute value of the relative width of the empirical resource distributions (Res |W95|) plotted against species richness (S). (c) Mean absolute niche model error (|ME|) plotted against S. (d) The fraction of links correctly predicted by the PNM (fL) plotted against S. Black circles show results for extant food webs. Green and red triangles show results for the Messel forest and lake food webs, respectively, with open triangles indicating results for reduced web versions.

