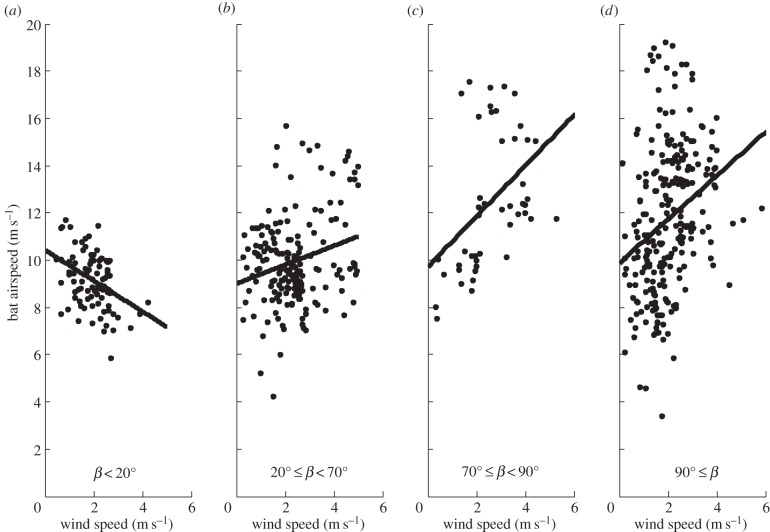
Figure 3.
Regression analysis of the relationships between bat airspeed and wind speed for different sections of wind directions relative to bat heading. This analysis is based on theoretical calculations outlined in Liechti et al. [13]. Full statistical details of the analysis are reported in table 1. This analysis corresponds well with qualitative predictions as the regressions have a negative slope for wind direction <20° (a), a low positive slope for wind direction between 20° and 70° (b), and a steeper positive slope for wind directions between 70° and 90° (c) and between 90° and 180° (d). See details in table 1.

