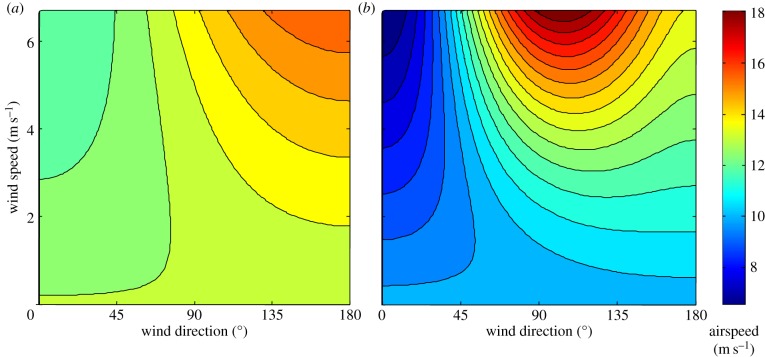
Figure 4.
Calculations of bat airspeed according to the species’ power curve and the wind speed and direction as proposed by Liechti et al. [13]. Bat airspeed is depicted by colour, according to wind direction (x-axis) and wind speed (y-axis). (a) Results of the analysis of tracked Eidolon helvum bats’ data and atmospheric simulations output. (b) Theoretical relationships predicted by Liechti et al. [13], modified for E. helvum using the species’ power curve (see Material and methods).

