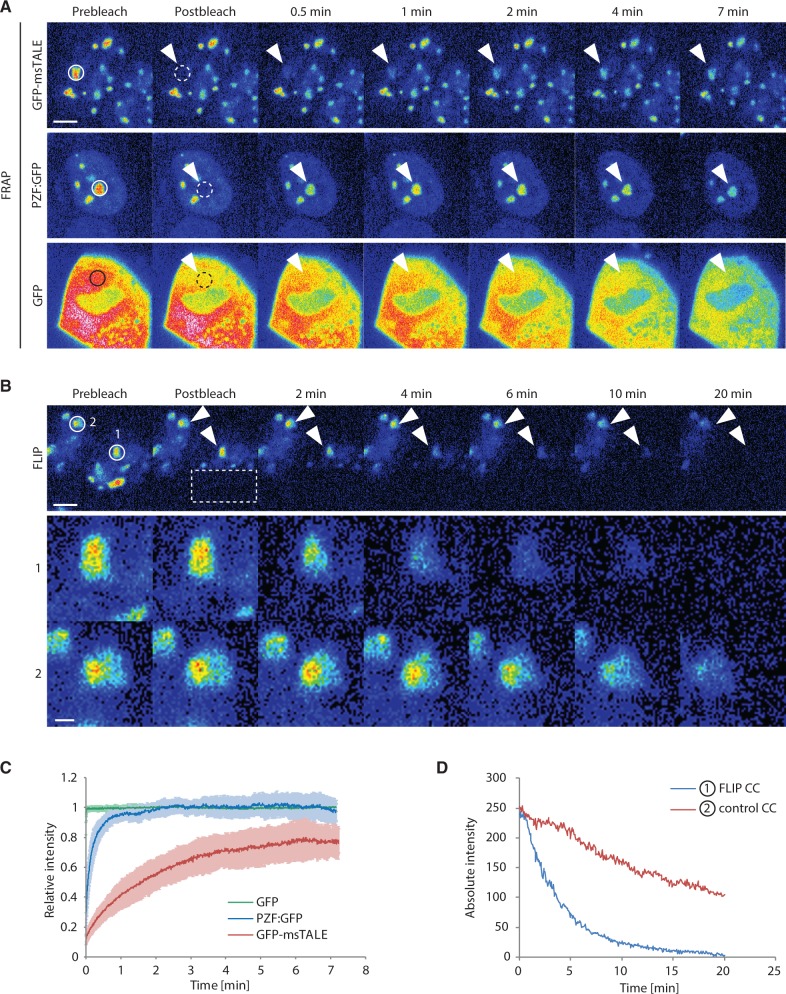
Figure 3.
Comparative analysis of the dynamics of GFP, GFP-msTALE and PZF:GFP by FRAP and FLIP. Continuous lines indicate the intensity measurement areas, whereas dashed lines indicate the bleached regions. The arrowheads point to the intensity measurement areas in the postbleach time points. These regions are magnified by a factor of four in the lower panel of (B). Scale bars: 5 µm (upper panel) and 1 µm (lower panel, (B)). (A) Representative FRAP experiment for GFP, the stable GFP-msTALE cell line and PZF:GFP. A circular region (dashed line) with a diameter of 2.5 µm was bleached. (B) Representative FLIP experiment of the GFP-msTALE. A rectangular region indicated by the dashed line was repeatedly bleached. CCs in the unbleached half of the bleached cell (1) and in an unbleached reference cell (2) are highlighted. (C) Quantitative evaluation of FRAP experiments (average of 12–14 cells) comparing GFP-msTALE, PZF:GFP and GFP. Error bars represent standard deviation. (D) Representative background corrected, absolute intensities of two CCs in a bleached cell (1, blue line) and an unbleached reference cell (2, red line) illustrated in (B).

