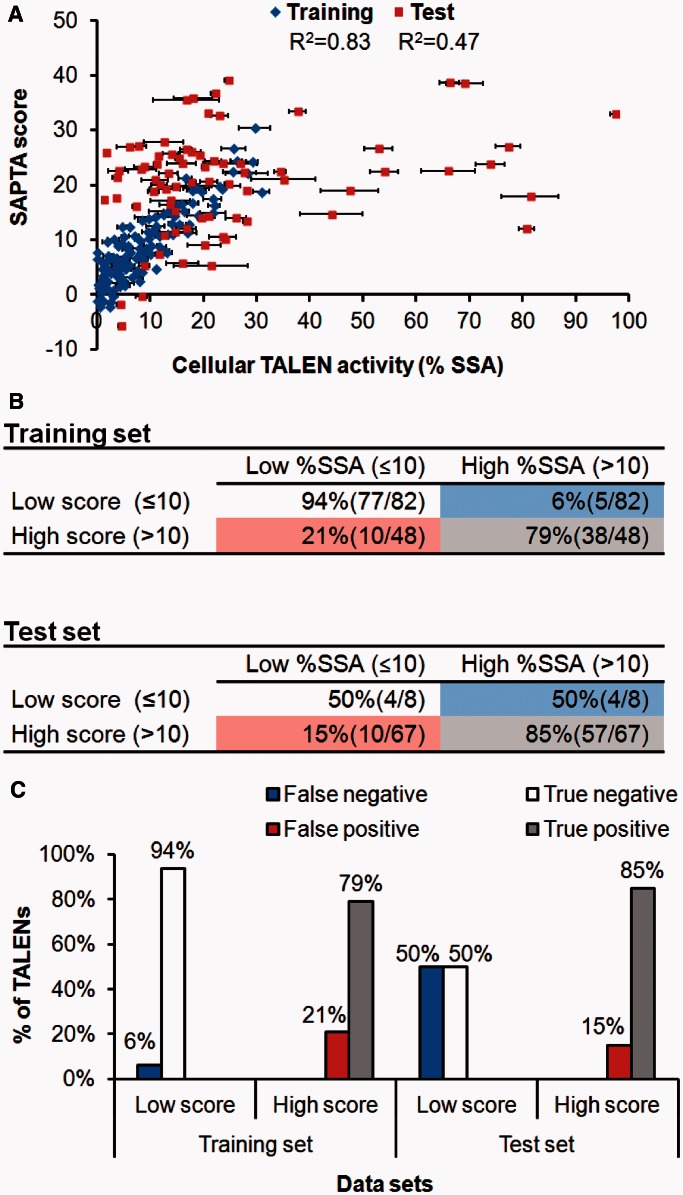
Figure 3.
Development and evaluation of SAPTA using 205 NK–TALEN monomers. (A) Correlation between predicted SAPTA scores (y-axis) and intracellular TALEN-monomer activity (x-axis) measured by the modified SSA assay in HEK293T cells. Error bars, s.e.m. (n = 3). (B) Categorization of TALENs in the Training Set and test set using 10% SSA activity as a cut-off for high activity. TALENs with low scores (≤10) and high scores (>10) are evaluated separately. (C) The percentages of TALENs predicted by SAPTA scores being false negatives (score ≤10 but %SSA >10%) and true negatives in the low score group, and false positives (score >10 but %SSA ≤10%) and true positives in the high score group.

