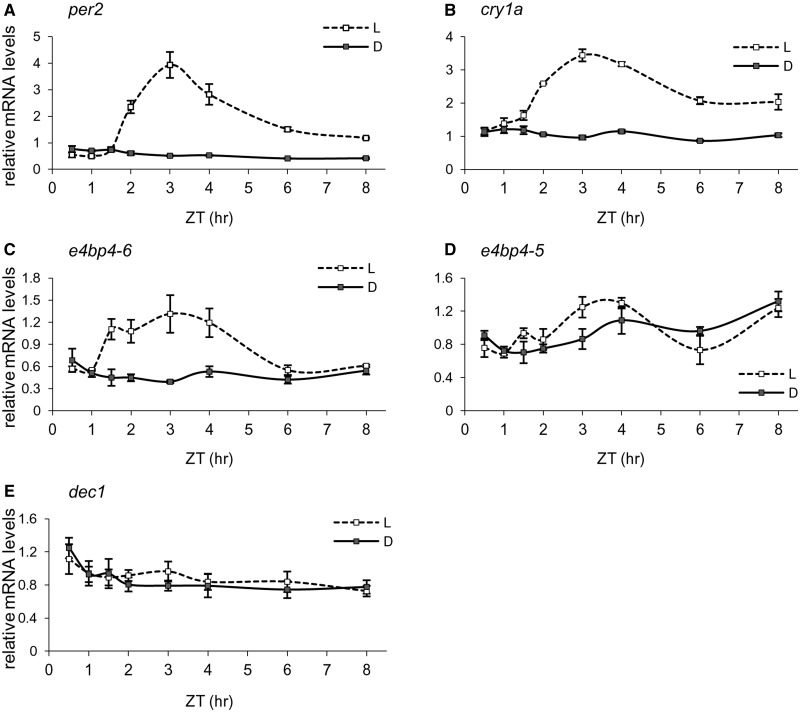
Figure 5.
Time course of light-induction in Pac-2 cells. Cells were exposed to three LD cycles. Subsequently, total RNA was extracted from cells kept in darkness (filled boxes) or exposed to light (empty boxes) for different time periods (0.5, 1, 1.5, 2, 3, 4, 6 and 8 h). Quantification of per2 (A), cry1a (B), e4bp4-6 (C), e4bp4-5 (D) and dec1 (E) mRNA levels was performed by qRT-PCR. Values shown are the mean of three independent cell pools; error bars represent SE. Statistical differences between photic treatments and sampling times were determined by two-way ANOVA. ZT = zeitgeber time, ZT0 corresponds to the time of light onset.

