Figure 2.
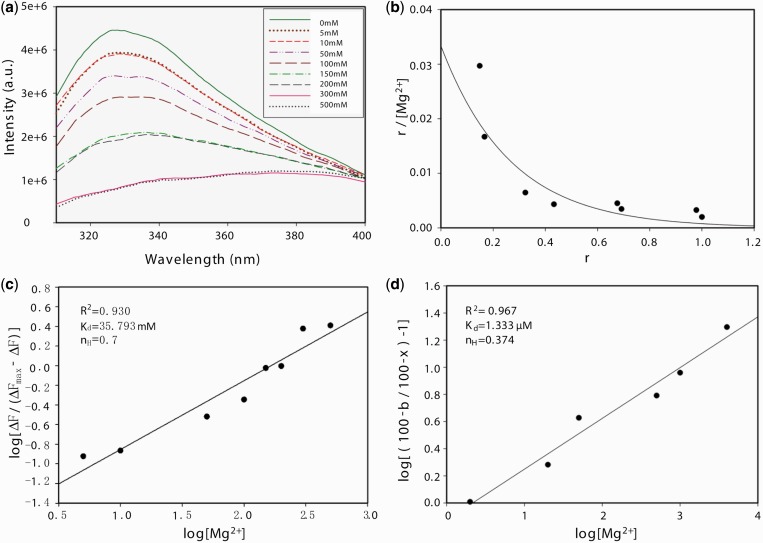
Fluorescence studies to probe the link between metal binding and DNase activity. (a) Cas5d tryptophan fluorescence undergoes quenching with increasing Mg2+ concentration (0–500 mM). The concentration of Mg2+ for the corresponding curve is indicated in the inset. The fluorescence intensity is shown in arbitrary units (a. u.). (b) Scatchard plot shows a concave-up curve. Here, r is represented as the ratio of ΔF and ΔFmax, where ΔFmax is the differential intensity at the infinite concentration of Mg2+. (c) Hill plot in the absence of DNA is shown. The linear trend suggests the existence of cooperativity. (d) The dependence of DNA cleavage on Mg2+ was analyzed by Hills plot. The maximal activity is taken as 100%. The percentage activity in the absence of Mg2+ is b, and x is the percentage activity in the presence of varying concentrations of Mg2+. For (c) and (d), R2 represents the square of the goodness of fit, (nH) denotes the Hill coefficient and Kd indicates the apparent dissociation constant.

