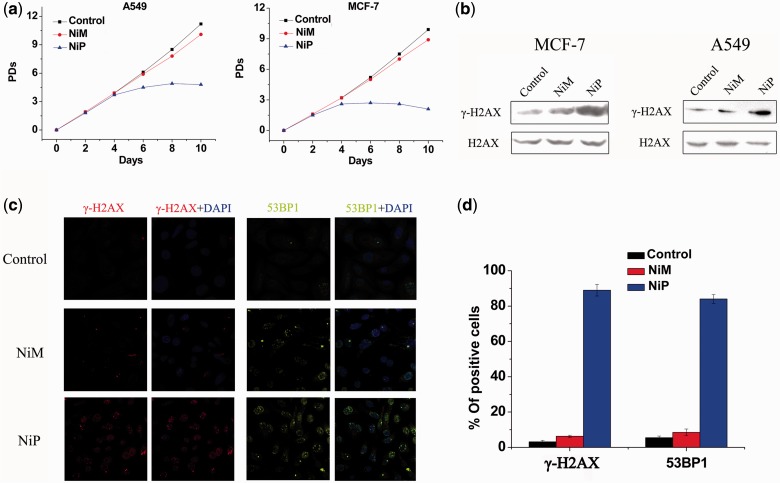
Figure 2.
Growth suppression induced by NiP associates with the production of DNA damage response. (a) Proliferation curves of A549 and MCF-7 cells treated with NiM and NiP (15 μM). At the indicated times, cells were counted and the PDs were determined. (b) Western blot analysis of γ-H2AX in A549 and MCF-7 cells treated with NiM, NiP for 24 h. The levels of H2AX were used as loading control. (c) Representative immunofluorescence images of γ-H2AX and 53BP1 foci in MCF-7 cells treated with NiM and NiP. (d) Percentage of cells containing γ-H2AX and 53BP1 foci in MCF-7 cells treated with NiM and NiP for 24 h. γ-H2AX and 53BP1 foci were quantified using mouse mAbs. On average, >200 cells were screened in three independent experiments. Error bars indicate standard deviations (SD).

