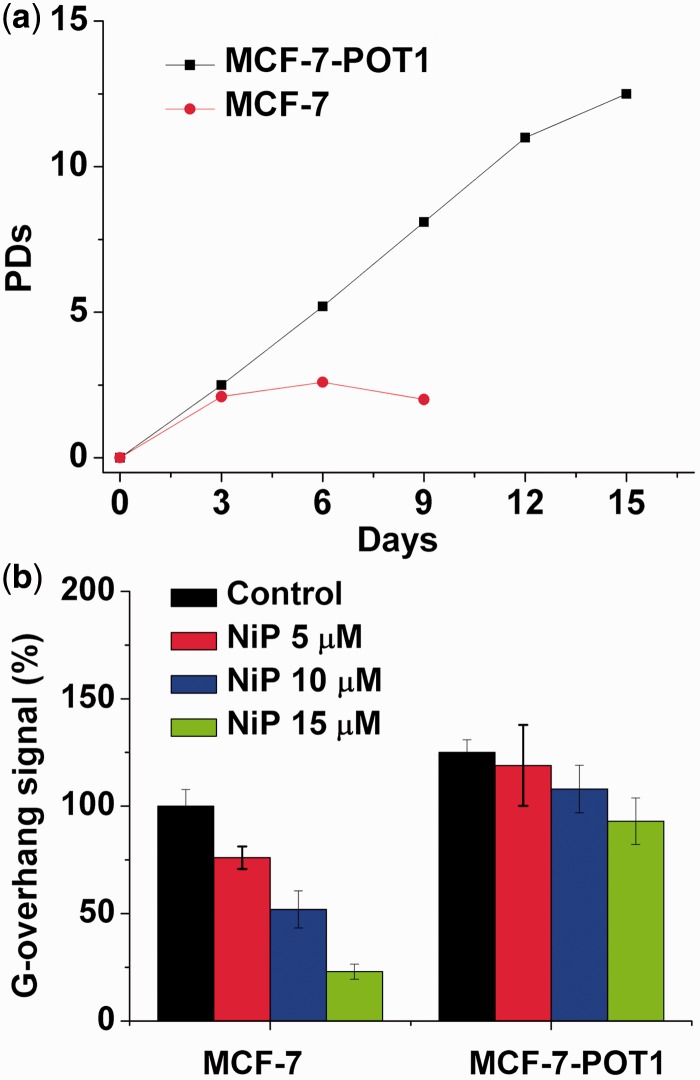
Figure 8.
Overexpression of POT1 increases G-overhang and protects cells from NiP effects. (a) Proliferation curves of MCF-7 and MCF-7-POT1 cells treated with NiP (15 μM). At the indicated times, cells were counted and the PDs were determined. (b) Hybridization protection assay (HPA) was performed on genomic DNA isolated from MCF-7 and MCF-7-POT1 cells treated with various concentrations of NiP to assess the length of G overhang. Luminescence intensity in arbitrary units (AU) was normalized against Alu probe. The mean of three independent experiments with comparable results was shown. Error bars indicated SD.

