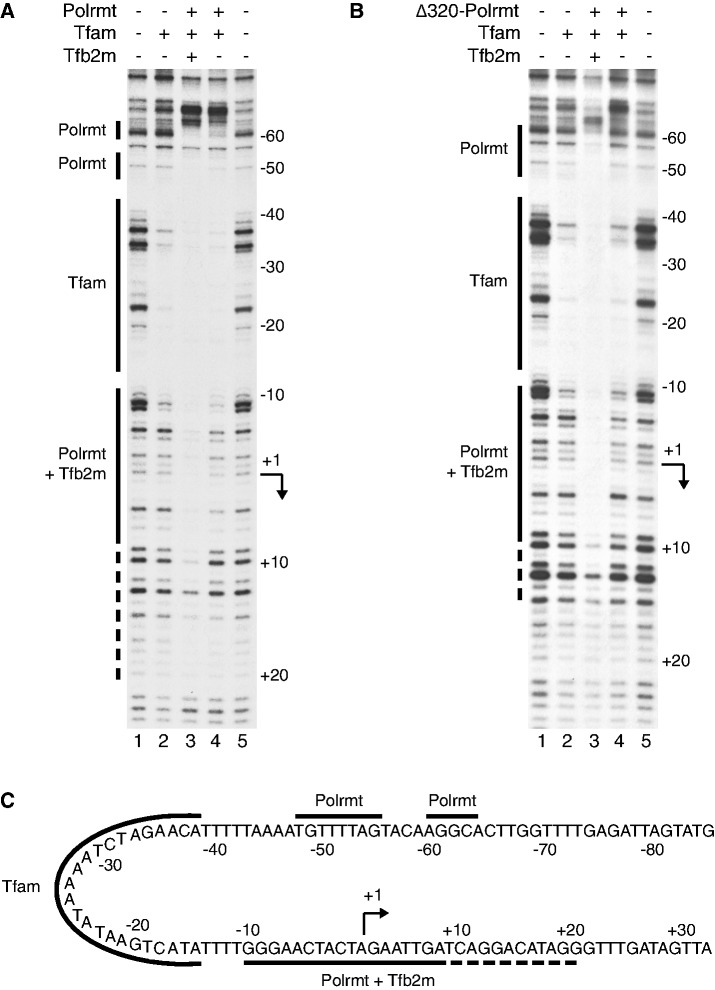
Figure 4.
A complex composed of Tfam and Polrmt forms at the LSP promoter even in the absence of Tfb2m. (A) DNase I footprinting reveals a Tfam footprint (lane 2; solid line marked Tfam) upstream the promoter. Addition of Polrmt and Tfb2m (lane 3) generates additional footprints (solids line marked Polrmt and Polrmt + Tfb2m, respectively), over the promoter and transcription start site as well as upstream the Tfam binding site at position −50 to −60. The dashed line indicates an extended weaker promoter footprint reaching to +20. When only Tfam and Polrmt are added (lane 4), there are still weak footprints over the promoter, and strong footprints over the −50 and −60 region. Also a clear border is visible upstream the −60 footprint (B) Δ320-Polrmt leaves a similar, but not identical, footprint at the promoter and the −50 and −60 region in presence of both transcription factors (lane 3) but almost no footprint in absence of Tfb2m (lane 4). (C) A schematic representation of the protected areas of the mouse LSP promoter region. Tfam protects around −11 to −40, Polrmt protects the promoter and the transcription start site extending to +20 and two smaller regions around −50 and −60. The Polrmt promoter protection is strongly enhanced by Tfb2m. With the 180° bending effect of Tfam, it becomes clear that the different Polrmt-DNA interaction sites are placed close to each other in space.

