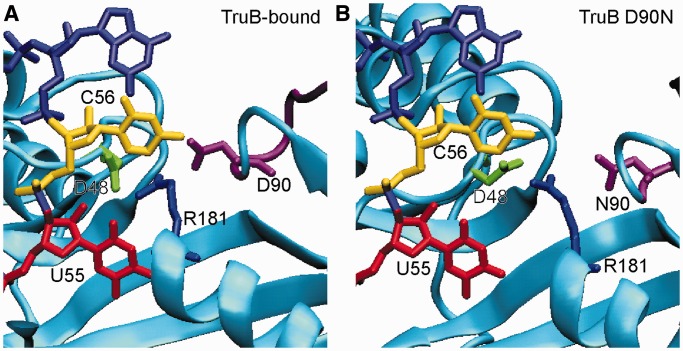
Figure 8.
Selected conformation of TruB active site residues during MD simulations. Representative active site conformations where R181 (blue) was found in close proximity to both D48 (green) and D90 within insert 1 (purple) are shown. RNA from the TruB-RNA crystal structure (PDBID 1ZL3) was modeled into the simulation frames (red/yellow/light purple). (A) Snapshot at 9.1 ns of the TruB-bound simulation. D48–R181 C-C distance: 3.7 Å, D90–R181 C-C distance: 3.9 Å. (B) Snapshot at 15.6 ns of the TruB D90N simulations. D48–R181 C-C distance: 3.6 Å, N90-R181 C-C distance: 4.6 Å. In neither frame do the interactions between the active site residues clash with the crystal structure position of the RNA substrate.

