Figure 2.
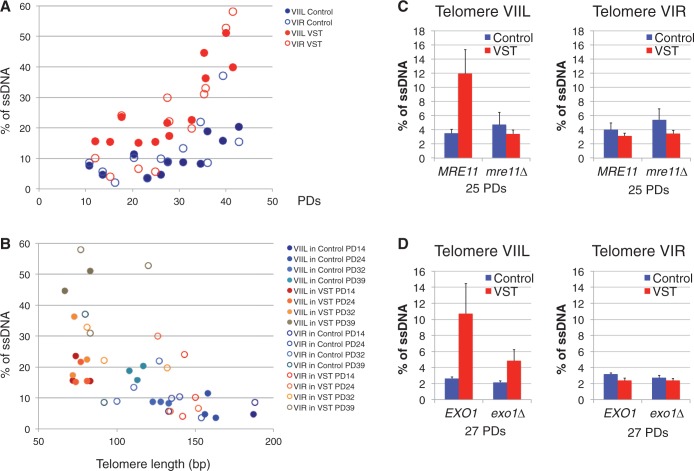
The accumulation of subtelomeric ssDNA by end resection contributes to senescence. (A) A mixture of tlc1Δ colonies derived from yT136 or yT138 was grown in liquid-rich medium with daily dilutions. DNA was prepared every day, and for each culture the number of PDs grown in liquid culture was estimated. Genomic DNA was prepared and ssDNA quantity was monitored by QAOS using a probe located 56 nt away from the telomeric repeats of telomere VIR (open circles) and 139 nt away from the telomeric repeats of telomere VIIL (full circles) in Control (blue circles) and VST (red circles) tlc1Δ cells and plotted according to the PDs since the loss of telomerase. (B) DNA samples from (A) were used to determine the telomere length of VIR and VIIL by telomere-PCR. ssDNA determined as above was plotted according to telomere length. Circle colors indicate whether DNA was from Control cells (blue circles) or VST cells (red-brown circles). Full or open circles indicate whether data correspond to VIR (open circles) or VIIL (full circles) telomeres. PD indicates the number of estimated PDs in liquid cultures after mass sporulation and colony formation. (C) MRE11 tlc1Δ and mre11Δ tlc1Δ colonies derived from yT235 or yT236 were grown in liquid-rich medium for ∼25 population doublings. Genomic DNA was prepared from Control (blue) and VST (red) cells and ssDNA quantity was monitored by QAOS as in (A) (n = 3–4 clones per genotype). (D) Same as in (C) with EXO1 tlc1Δ and exo1Δ tlc1Δ colonies derived from yT403 or yT404 grown for ∼27 population doublings (n = 3–4 clones per genotype).

