
Figure 2.
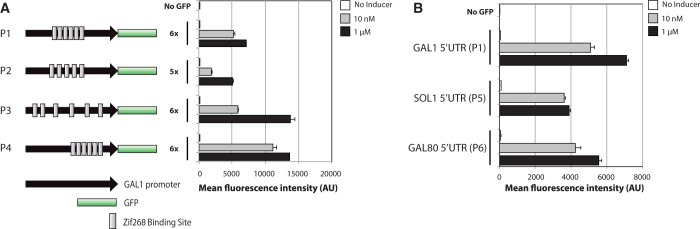
Engineered GAL1 promoter variants. (A) Measuring the effects of Zif268 binding site location and spacing on Z3EV-mediated gene induction. Schematic cartoons (not drawn to scale) illustrate the tested promoter architectures and bar plots are measurements of GFP intensity in the presence or absence of inducer following ∼12 h of induction. (B) Measuring the effects of 5′-UTR sequence on Z3EV-mediated gene induction, by replacing the GAL1 5′-UTR with that of SOL1 or GAL80. Error bars represent the standard deviation of fluorescence from three independent colonies/cultures.