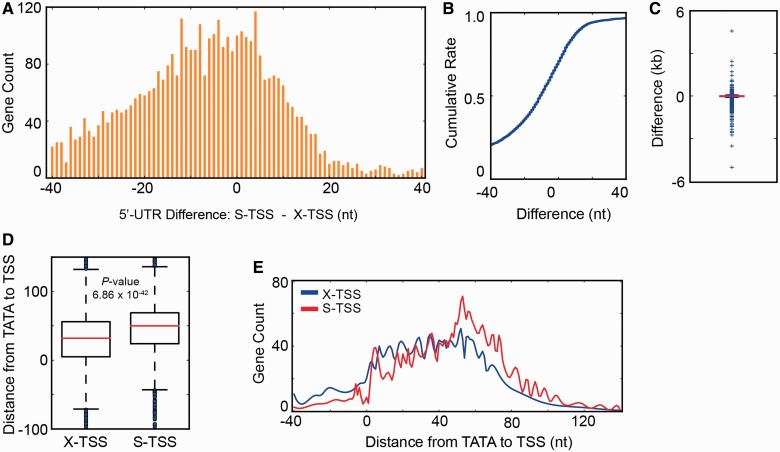
Figure 2.
(A–C) Comparison of SMORE-seq TSS coordinates (S-TSS) with the commonly referenced TSS coordinates reported by Xu et al. (X-TSS) (6) by histogram (A), cumulative distribution (B) and box plot (C), demonstrating that S-TSS and X-TSS are in high agreement. Overall, 5′-UTRs of S-TSS are shorter (S-TSS are more downstream). (D and E) Distance between TATA-like elements in TATA-less genes (n = 4065) (7) and S-TSS or X-TSS. S-TSS shows a narrower distribution with a larger average distance.

