
Figure 2.
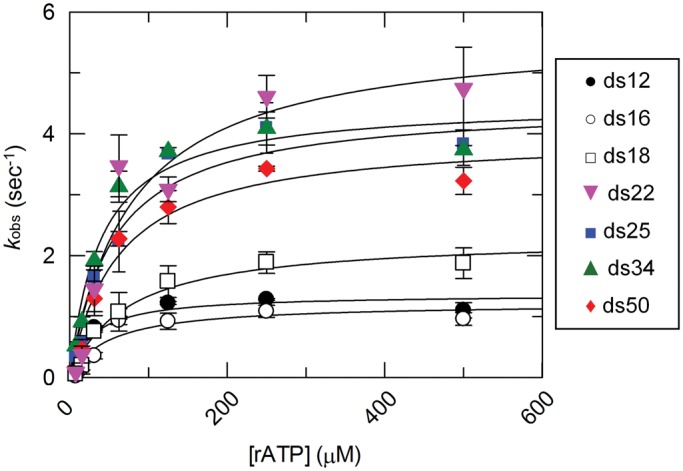
Steady state ATP hydrolysis of DRH-3 with various RNA duplexes. Steady state rate constants for DRH-3 bound to ds12, ds16, ds18, ds22, ds25, ds34 and ds50 are plotted as a function of substrate (rATP) concentration. The data were fitted to the Michaelis–Menten equation, resulting in the following values: ds12 (black circle), kcat = 1.36 ± 0.13 s − 1, KM = 28 μM; ds16 (blank circle), kcat = 1.22 ± 0.18 s−1, KM = 49 μM; ds18 (blank square), kcat = 2.31 ± 0.20 s−1, KM = 72 μM; ds22 (gray down triangle), kcat = 5.69 ± 0.79 s−1, KM = 77 μM; ds25 (black square), kcat = 4.49 ± 0.32 s−1, KM = 54 μM; ds34 (gray up triangle), kcat = 4.51 ± 0.34 s−1, KM = 40 μM; ds50 (gray diamond suit), kcat = 3.98 ± 0.37 s−1, KM = 61 μM. Plotted values are mean ± SD (n = 3). The concentrations of DRH-3 and RNA used were as follows: 400 nM DRH-3 and 800 nM ds12, 400 nM DRH-3 and 800 nM ds16, 200 nM DRH-3 and 600 nM ds18, 100 nM DRH-3 and 300 nM ds22, 100 nM DRH3 and 300 nM ds25, 100 nM DRH-3 and 300 nM ds34, and 100 nM DRH-3 and 300 nM ds50. ATP concentration was varied from 7.8 to 500 μM.