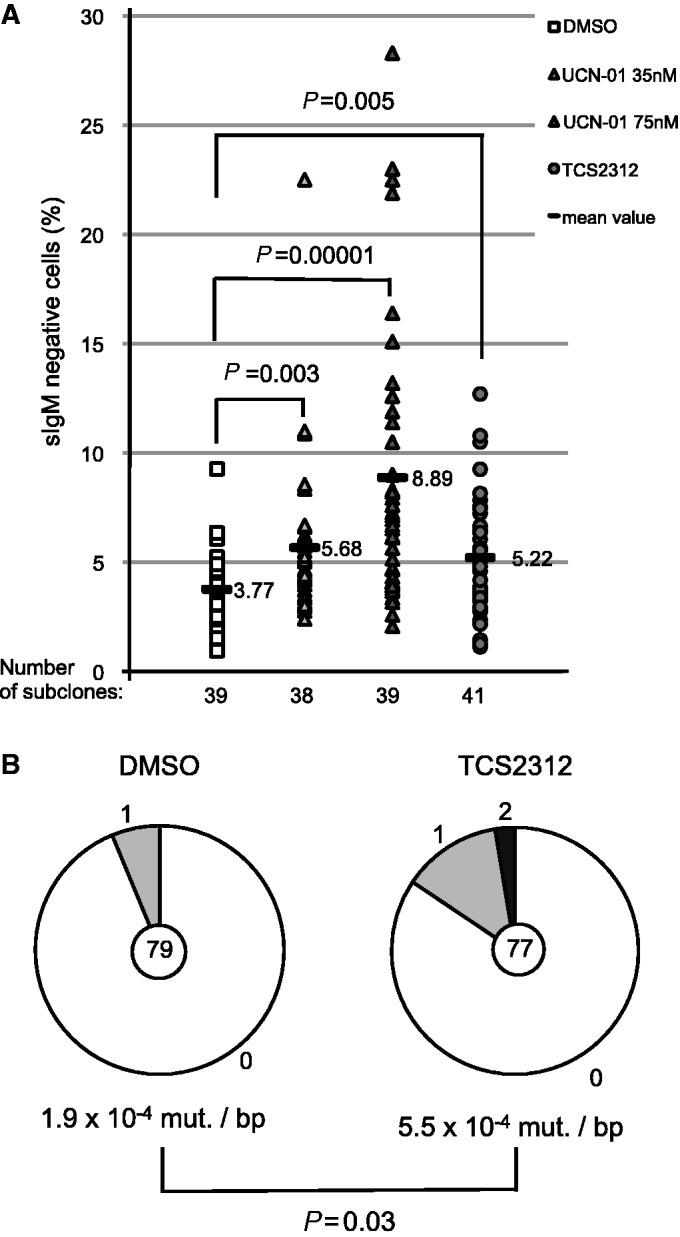
Figure 5.

Chk1 inhibition leads to increased hypermutation of the endogenous Ig locus in RAMOS cells. (A) IgM loss on culture of RAMOS cells in the absence or presence of the Chk1 inhibitors (TCS2312 125 nM, UCN-01 35 nM and 75 nM). Statistically significant differences are marked with brackets and P-values are given (Student’s t-test). (B) Sequencing analyses of a segment of the Ig locus, spanning from framework region 1 to the JH gene, of representative subclones of the analysis shown in (A). The total number of sequences analyzed is indicated in the center of the chart and the number of point mutations per DNA sequence is given in the periphery of the pie chart segments. Significance analysis: X2 test.
