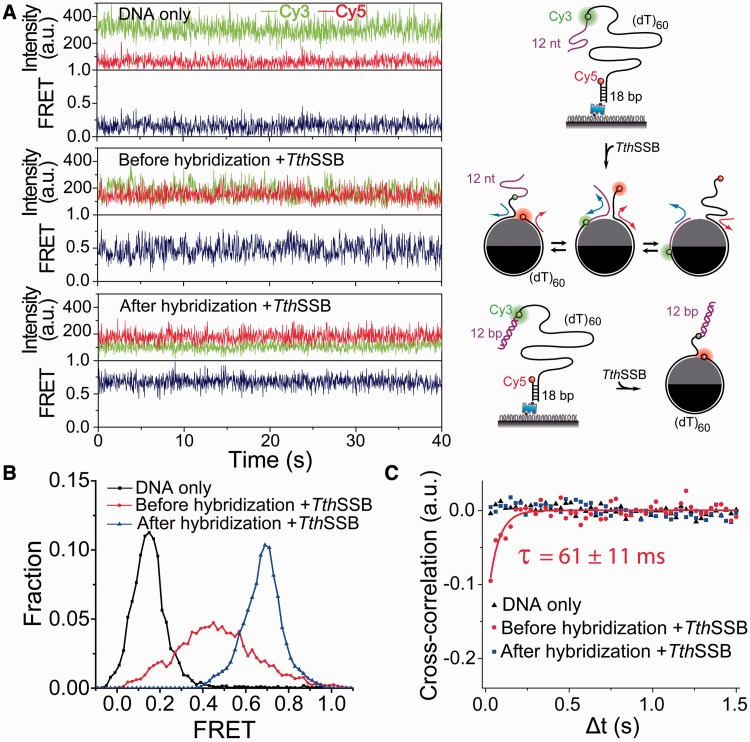
Figure 2.
Protein diffusion detection assays based on DNA hybridization. (A–C) Representative single-molecule time traces (A), smFRET histograms (B) and average cross-correlation curves (C), for (dT)60+12m DNA alone and TthSSB-bound (dT)60+12m with and without the hybridization to the 12-nt mixture sequence ssDNA region. FRET fluctuations beyond measurement noise were detected only when the 12-nt extension is available for TthSSB binding. Unbound proteins were removed before data acquisition such that the FRET flucatuations reflect only the repositioning of the bound TthSSB along (dT)60+12m. For simplification, the 18-bp duplex DNA region is not shown for TthSSB-bound (dT)60+12m in (A). The solid line in (C) is a fit to a single exponential function.

