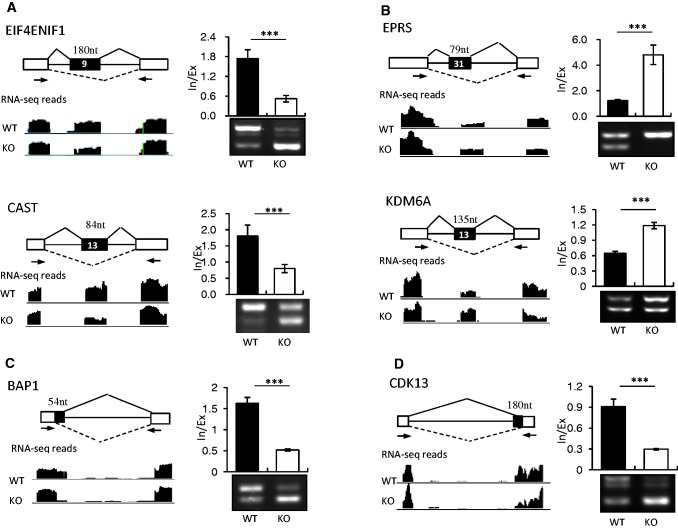
Figure 2.
SRSF10 can promote both exon inclusion and exclusion in vivo. SRSF10-activated cassette exons (A), SRSF10-repressed cassette exons (B), SRSF10-activated alternative 5′ exons (C) and SRSF10-activated alternative 3′ exons (D) were identified by RNA-seq analysis and validated by RT-PCR. Each case is schematically diagrammed with mapped RNA-seq reads that cover the corresponding exons (left panels). Black boxes, alternative exons; black lines, introns; white boxes, flanking constitutive exons. The primer pairs used for RT-PCR are indicated by arrows. SRSF10-regulated AS changes were analyzed by RT-PCR (right bottom panels). Quantification of the RNA products was measured as the inclusion/exclusion (In/Ex) ratio, as shown in the top right histogram. Values shown are the mean ± SD, n = 3. Significance for each detected change was evaluated by Student’s t-test.

