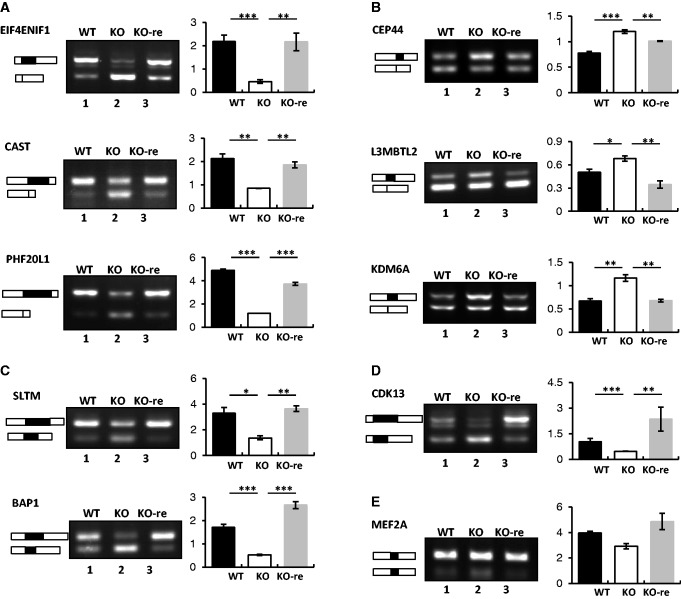
Figure 3.
Exogenous expression of SRSF10 in KO cells restores WT splicing patterns of SRSF10-targeted transcripts. SRSF10-activated cassette exons (A), SRSF10-repressed cassette exons (B), alternative 5′ exons (C), alternative 3′ exons (D) and mutually exclusive exons (E) were analyzed for splicing changes in WT, KO and KO-re cells by RT-PCR (left panels). The primers used for RT-PCR are the same as in Figure 3. Bar graphs show the ratios of inclusion versus exclusion (A–D) or exon a versus exon b (E) (right panels). Values shown are the mean ± SD, n = 3. The significance of each detected change was evaluated by Student’s t-test.

