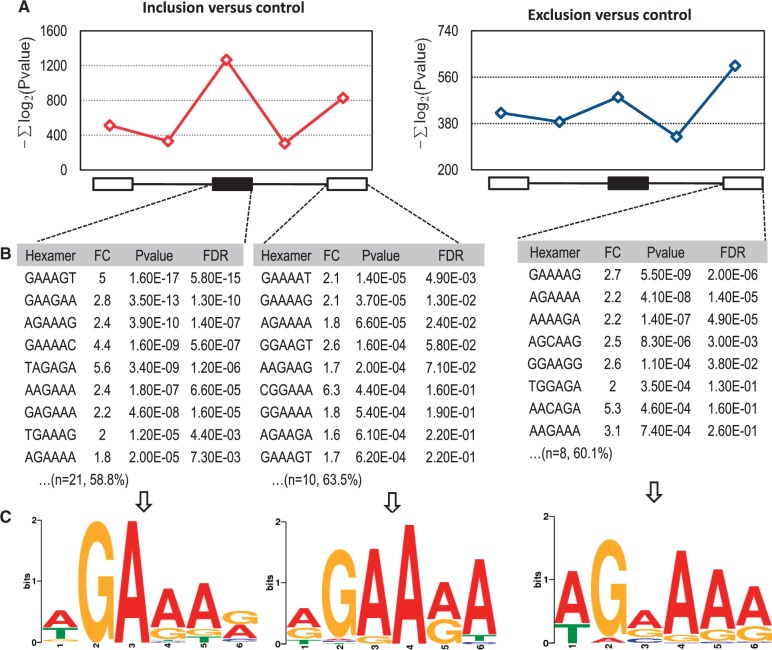
Figure 4.
Hexamer and MEME analysis of SRSF10-regulated exon inclusion and exclusion. (A) The sum of the minus log2-transformed P-values of GA-rich hexamers within the five regions around regulated cassette exons was compared with control cassette exons that are not affected by SRSF10. The red line represents SRSF10-mediated exon inclusion compared with the control (left), and the blue line represents SRSF10-mediated exon exclusion compared with the control (right). There is no obvious peak in the upstream exon or the two flanking introns around the cassette exons. (B) A representative list of top GA-rich hexamers was shown for SRSF10-activated cassette exons, -activated downstream constitutive exons and -repressed downstream constitutive exons, respectively. FC is fold change, P-value stands for statistically significance of GA-rich hexamers between SRSF10-regulated group and controls and FDR indicates false discovery rate. Shown in brackets are the number of overrepresented GA-rich 6-mers and the percentage of exons containing at least one overrepresented 6-mer. (C) Potential GA-rich motifs derived from the aforementioned overrepresented GA-rich 6-mers using MEME (P < 0.0001).

