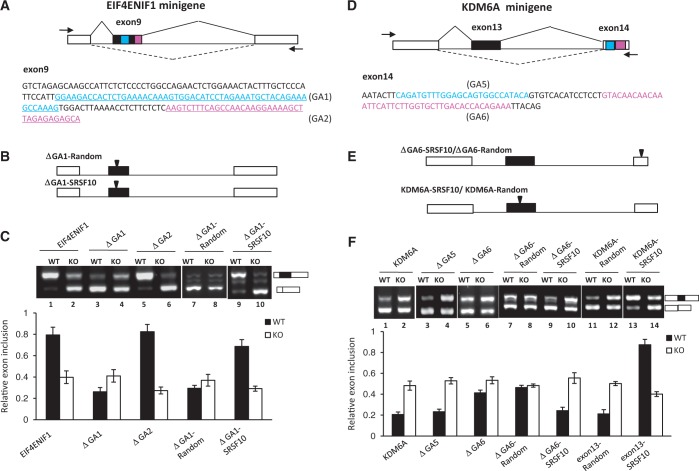
Figure 5.
Characteristics of SRSF10-regulated exon inclusion and exclusion. (A) Schematic representation of the EIF4ENIF1 minigene construct (top). The intact genomic region of EIF4ENIF1 from exon 8–10 was cloned into the CMV-Tag2b vector. The exon 9 sequences are shown at the bottom, with two GA-rich motifs (GA1 and GA2) marked with a different color. The PCR primers used to detect the alternatively spliced products are indicated by arrows. (B) Three copies of the SRSF10 consensus binding motif or random sequences were inserted within the middle exon of the GA1-deletion construct. (C) RT-PCR analysis of the EIF4ENIF1 minigene or each of the indicated mutants transfected in WT or KO cells, respectively. The percentage of exon inclusion is shown at the bottom of the gel. Values shown are the mean ± SD, n = 3. (D) Schematic representation of the KDM6A minigene construct (top). The intact genomic region of KDM6A from exon 12–14 was cloned into the CMV-Tag2b vector. The exon 14 sequences are shown at the bottom, with two potential GA-rich motifs (GA5 and GA6). The PCR primers are indicated by arrows. (E) Three copies of the SRSF10 consensus binding motif or random sequences were either inserted within exon 14 using the GA6-deletion construct (top) or within exon 13 of the KDM6A minigene (bottom). (F) RT-PCR analysis of the KDM6A minigene or each of indicated mutant transfected in WT or KO cells, respectively. The histogram below shows mean percentage of exon inclusion ± SD, n = 3.

