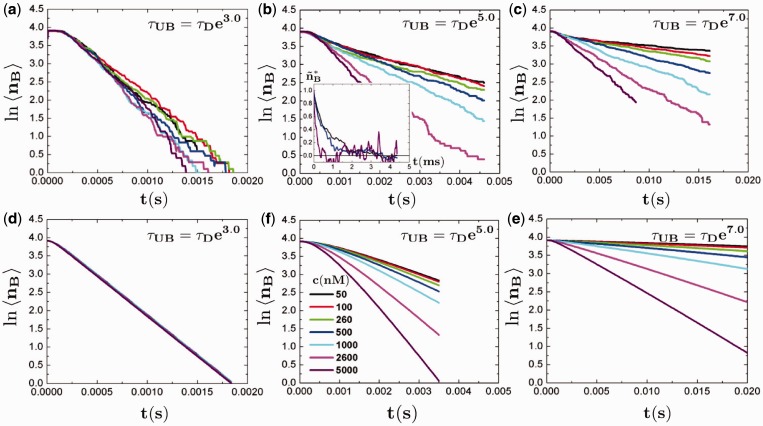
Figure 4.
Binder exchange simulation data for (a)  , (b)
, (b)  and (c)
  . At time
  , the DNA chain is saturated with binders (number of occupied sites
  ), and the concentration [shown in legend in (b)] is immediately applied to the system. In (a) the exchange is mostly diffusion-limited, and there is not a large difference on changing the binder concentration. In (b) and (c) exchange occurs at different rates depending on the external concentration c of untagged binders. Numerical calculation using the matrix kij in Equation (3) yields nearly quantitative matching, as shown in (d–f) [corresponding to (a–c), respectively]. The inset in (b) plots the normalized overall relaxation of the number of tagged and untagged binders
  as a function of time t in analogy to the main plot in (b). Colors correspond to concentrations in b and demonstrate a concentration-dependent approach to equilibrium (
 ) that is concomitant with the concentration-dependent exchange process.

