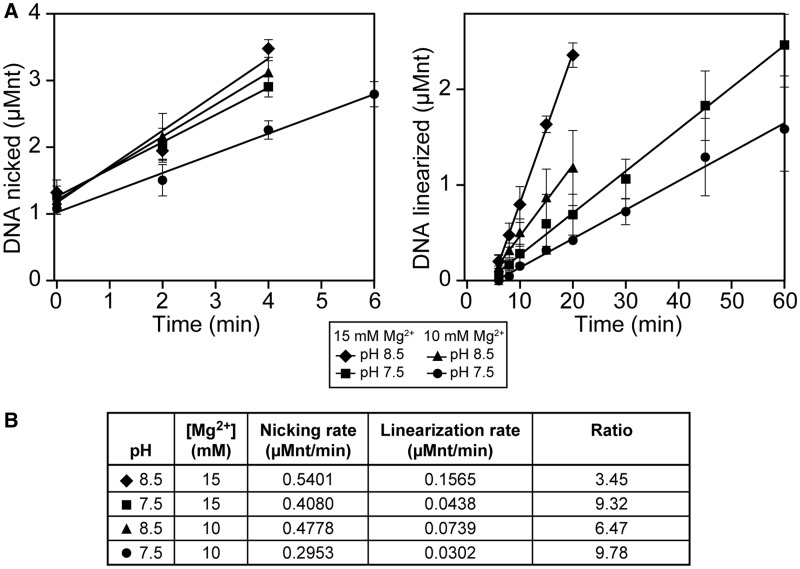
Figure 4.
Cutting of the paired and displaced strands exhibit different rates and requirements. (A) Targeted nuclease assays were carried out, imaged and analyzed as described in ‘Materials and Methods’ section using buffer A*(pH, Mg). Shown is a graphical representation of gel electrophoresis analysis of products (left: nicked, and right: linear). Filled diamonds correspond to standard buffer conditions used throughout the article. Percentage product formation was converted to actual DNA concentration (in µMnt) and the initial linear portion of each curve was used to calculate the best-fit line and slope. (B) Nicking and linearization rates were determined using the slope of the lines in (A). The ratio of the two rates changes with changing buffer conditions, indicating that the nicking and linearization processes are affected differentially by pH and Mg2+ concentration.

