Figure 3.
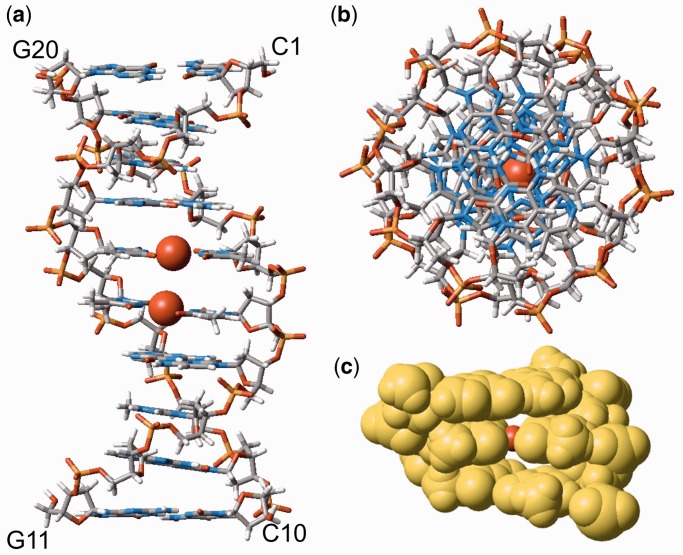
The 3D structure of HgII-bound DNA duplex 1•2. (a) The side view perpendicular to helical axis. (b) The top view along helical axis. (c) The space-filling model of the middle 3-bp DNA segment including G4–C17, T5–HgII–T16 and T6–HgII–T15 pairs sketched out in Figure 1e. The Hg atoms are depicted always as red balls. The Hg–Hg distance derived solely with NOEs was ∼4 Å. When we applied the Hg–Hg distance constraint at 3.3 Å reflecting our X-ray diffraction analysis of a DNA duplex with tandem T–HgII–T base pairs (53) (Supplementary Figure S6 and Supplementary Material), the derived model structure of duplex 1•2 (Supplementary Figure S7) was consistent with the NOE constraints.

