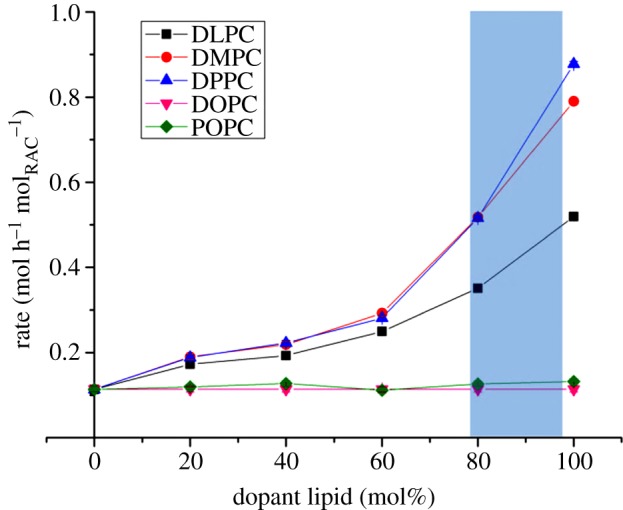
Figure 5.

The relationship between saturated-chain lipid concentrations in the membrane and the rate of its hydrolysis by raclopride tartrate. Remaining proportion of membrane was composed of DOPC. Error bars are derived from figure 4 and are smaller than data markers. Shaded region highlights the region of domain formation in DOPC–DPPC systems, as identified by fluorescence methods [15] and X-ray diffraction [16]. (Online version in colour.)
