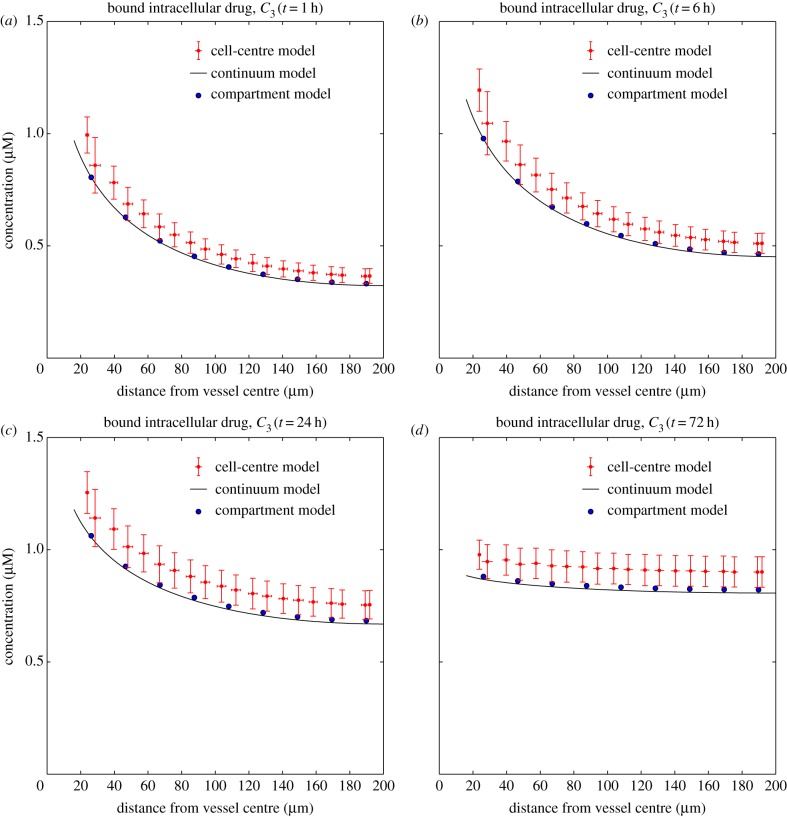
Figure 5.
Dependence of the concentrations of bound drug, C3, on distance from the drug supply at times t = 1 h (a), t = 6 h (b), t = 24 h (c) and t = 72 h (d). The solid line represents the continuum model, the large solid dots represent the compartmental model and the smaller dots with vertical and horizontal bars represent the cell-centre model. The tri-exponential (IV bolus) PK profile has been used as input. (Online version in colour.)

