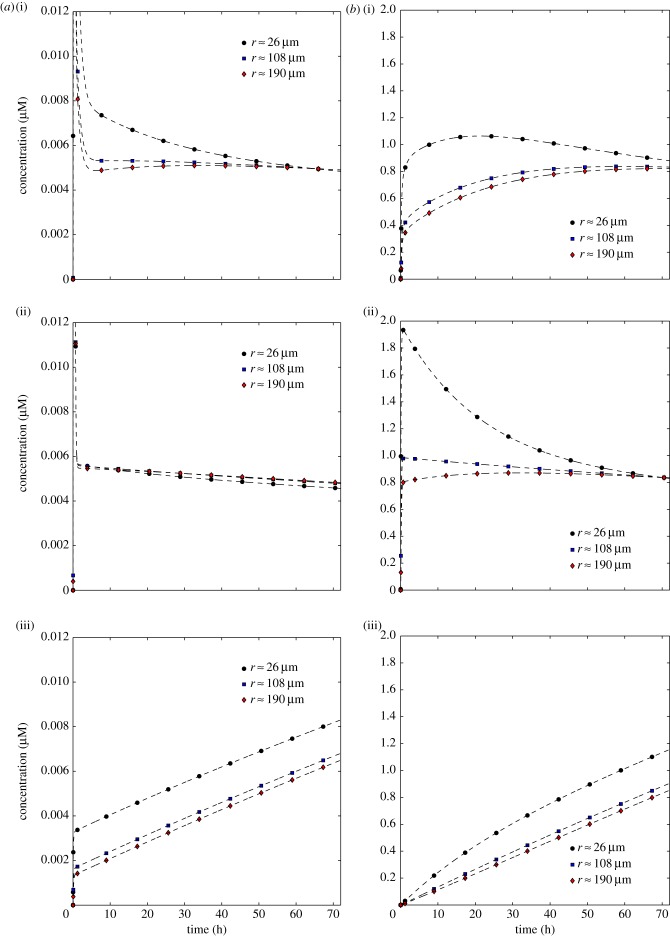
Figure 7.
Dependence of the concentrations of extracellular drug, C1 (a), and bound drug, C3 (b), on time for three PK profiles: tri-exponential/IV bolus (i), mono-exponential/simplified IV bolus (ii), uniform/infusion (iii). Each graph shows profiles at the centres of the first, fifth and ninth of the model's shells (distances 26, 108 and 190 μm from the centre of the vessel). (Online version in colour.)

