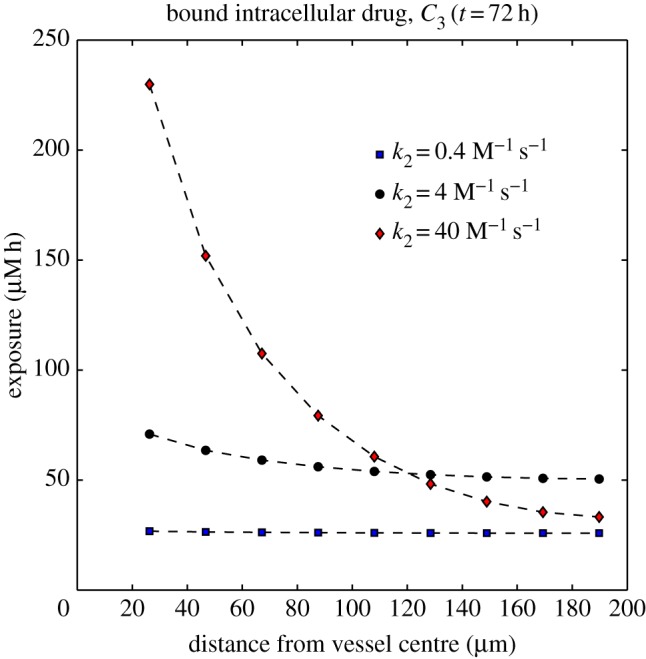
Figure 9.

Dependence of the exposure to bound drug  on distance from the supply of drug at t = 72 h for three different binding affinities where the association rate constant only varies over the range: k2 = 4 × 10⁻⁷, k2 = 4 × 10⁻⁶ and k2 = 4 × 10⁻⁵ μM−1 s−1. The tri-exponential/IV bolus PK profile was used as input. (Online version in colour.)
