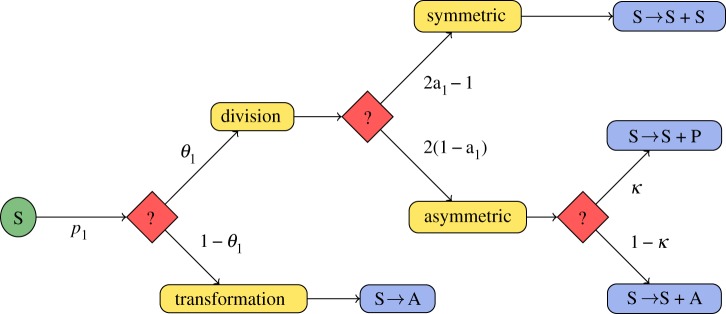
Figure 1.

Proliferation diagram of a stem cell. Red nodes indicate events with stochastic outcome (e.g. division or transformation; symmetric or asymmetric division), blue nodes describe the outcome of particular events using chemical reaction notation (S, stem cell, P, neural progenitor, A, astrocyte). θ1 denotes the probability of stem cell division, p1 denotes the proliferation rate; a1 reflects the probability that a daughter cell has the same fate as its parent cell (self-renewal takes place) and κ is the probability that a neural progenitor is produced in an asymmetric division rather than an astrocyte.
