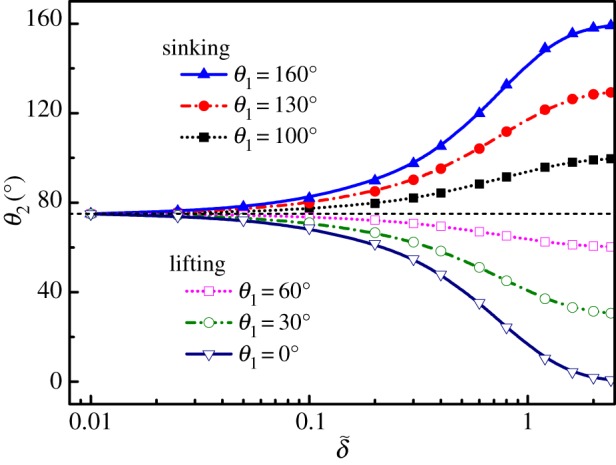
Figure 3.

Plots of θ2 as a function of  with respect to different θ1 for Bo=1×10⁻⁴ and θY=105°. Sinking positions: θ1=100°, 130° and 160° and lifting positions: θ1=60°, 30° and 0°. The black dashed line shows the neutral position (i.e. θ2=75°). (Online version in colour.)
