
Figure 4.
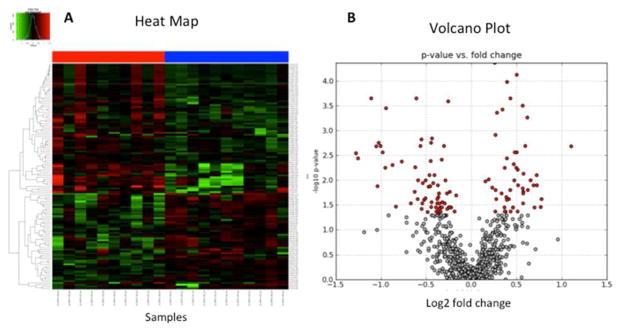
A heatmap (A) and volcano plot (B) produced by MetaboLyzer during a demonstrative analysis of a previously published urine metabolomics dataset comparing samples collected from 10 non-irradiated versus 11 irradiated C57BL/6 male mice. Irradiated mice were exposed to 8 Gy of gamma radiation, and urine samples were collected 24 hours after exposure. Both figures indicate a very strong response, with a significant number of ions showing increased as well as decreased excretion. 122 out of 765 complete-presence ions were found to be statistically significant by the Kolmogorov-Smirnov test (p < 0.05). Red dots in the volcano plot (A) indicate statistically significant ions, while grey dots are insignificant. Using the data from these 147 ions, a heatmap (B) was constructed. Red squares in the heatmap indicate increased excretion, while green squares indicate decreased excretion. Samples under the red bar are non-irradiated, while samples under the blue bar are irradiated.