
Figure 3.
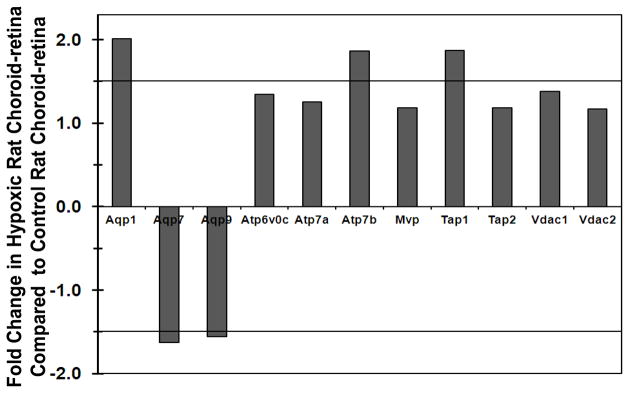
Fold change in miscellaneous transporter expression in hypoxic rat choroid-retina when compared to normoxic rat choroid-retina. Values above +1 indicate the up regulation and values below −1 indicates the down regulation of transporters in hypoxic condition. Thick black lines at ± 1.5 are cutoff lines for 50 % up regulation and down regulation. Data are expressed as mean for three biological replicates.