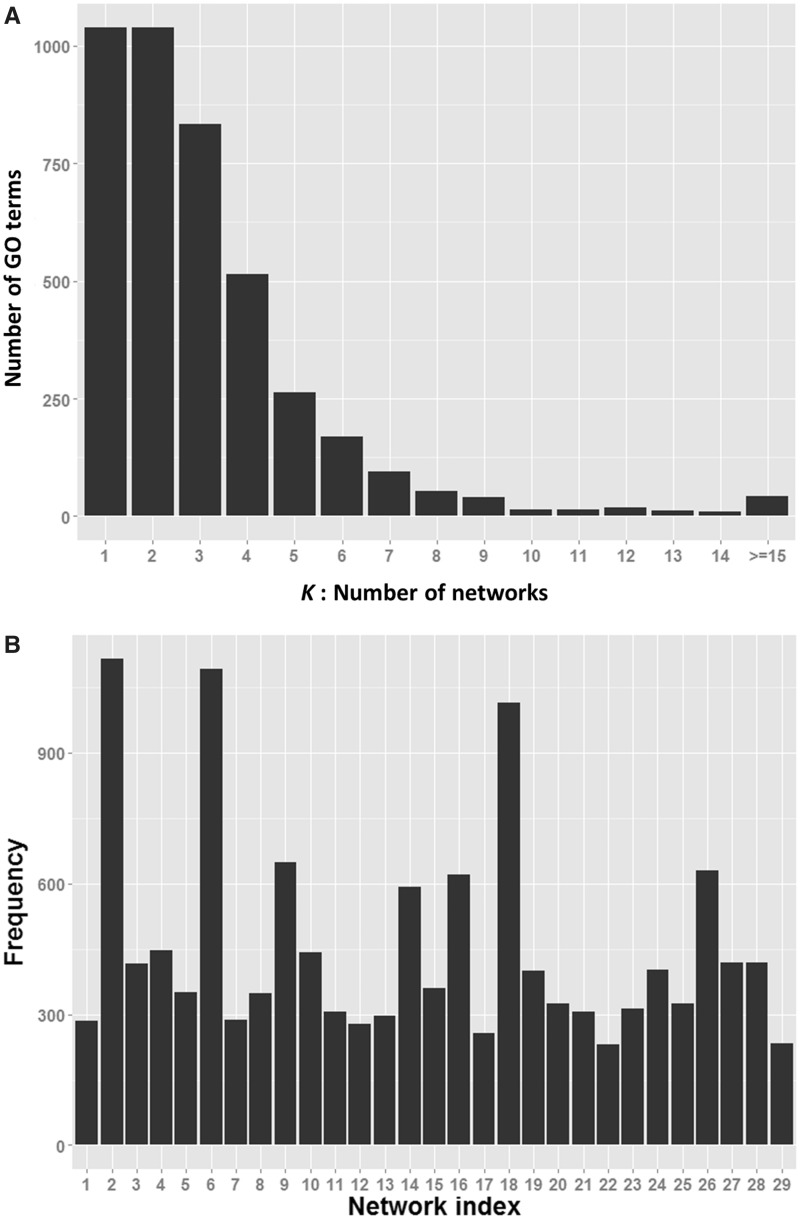
Figure 5.
Network usage in the final predictions. (A) Given the number (K) of networks selected by the wrapper method to achieve the best AUC scores, each bar represents the number of GO terms that use the K networks for predictions. (B) The frequency of each network chosen in the final predictive models. The indexes of these networks are those of their corresponding RNA-seq data sets.

