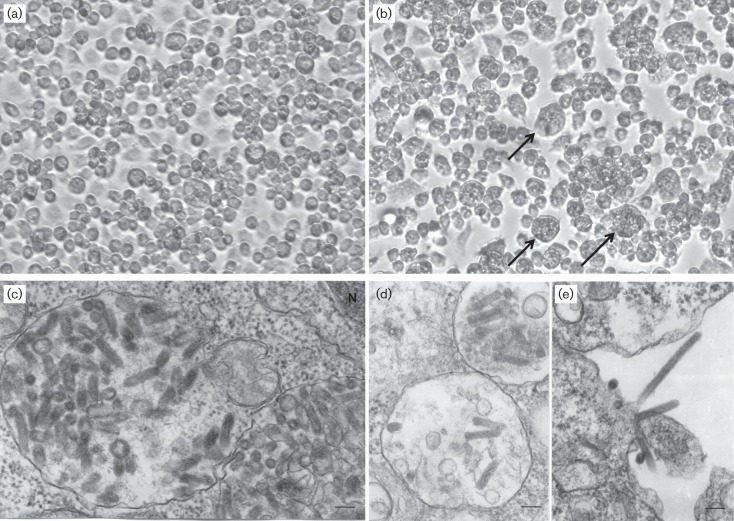
Fig. 1.
Cytopathology and ultrastructure of the viruses ABTV and PTAMV. (a) Control (non-infected) C6/36 cells. Magnification, ×200. (b) CPE seen in C6/36 cells 4 days after ABTV infection; cells are clumping together and detaching; some cells are enlarged and bloated in appearance (arrows). Magnification, ×200. (c, d) PTAMV virions inside intracytoplasmic vacuoles. Bars, 100 nm. N, Nucleus. (e) ABTV virions budding from the cell surface. Bar, 100 nm.

