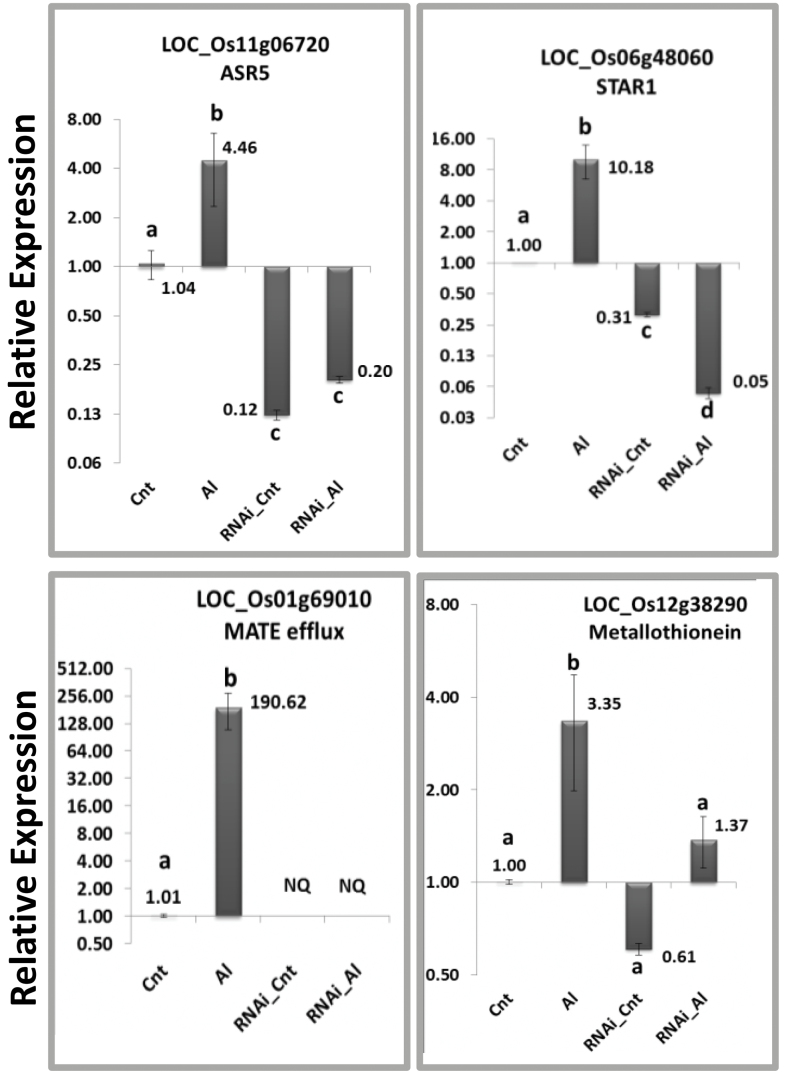
Figure 3.
Quantitative Real-Time RT–PCR of Four Selected Genes from the RNA-Seq Analysis.
Total RNA was extracted from the roots and used to synthesize cDNA. The relative expression was plotted using the expression levels of the FDH and Actin 2 genes as a reference. The roots of the Nipponbare cultivar were collected after 8h of treatment with AlCl3 (450 μM). The bars with different letters are significantly different (ANOVA, P < 0.05). Cnt, non-transformed plants under control conditions; Al, non-transformed plants under aluminum treatment; RNAi_Cnt, ASR5_RNAi plants under control conditions; RNAi_Al, ASR5_RNAi plants under aluminum treatment; NQ, not quantified.

