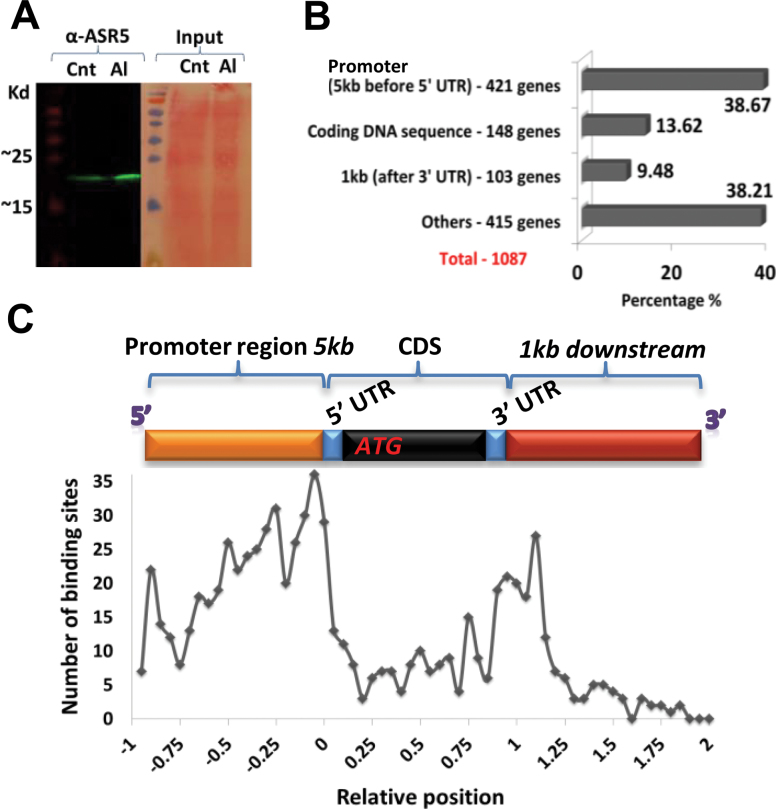
Figure 4.
ChIP-Seq Analysis of ASR5 Target Genes in Al-Treated Rice Plants.
(A) Western blot showing increased ASR5 protein levels in rice plants in response to Al. ASR5 was detected with anti-ASR5. (Cnt) indicates the control untreated plants, whereas (Al) indicates the plants that were treated with 450 μM AlCl3 for 8h.
(B) Number and percentage of loci found in each binding region.
(C) Distribution of the binding sites. The x-axis displays the relative distance; the promoter region group is indicated in the top yellow bar; the coding region group is indicated by top blue and black bars; and the downstream region group is indicated by the top red bar. The y-axis displays the number of binding sites located in the different groups.

