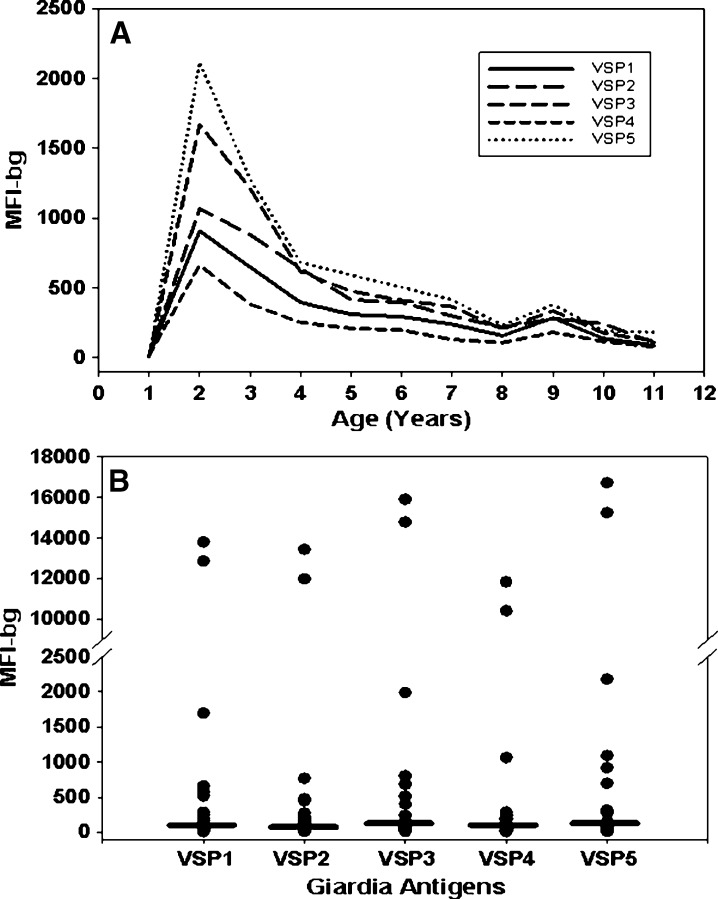
Figure 3.
Median immunoglobulin G (IgG) responses to Giardia antigens from Haitian children and adults. Shown are median IgG responses to Giardia antigens, variant-specific surface proteins, VSP1, VSP2, and VSP3 from assemblage A and VSP4 and VSP5 from assemblage B. A, line plot by age (years) on all children; and B, scatter plot on single serum specimens collected from 30 adults. Horizontal bars in scatter plot are median IgG responses. The IgG responses determined by Luminex, the median fluorescence intensity minus the background (MFI-bg).

