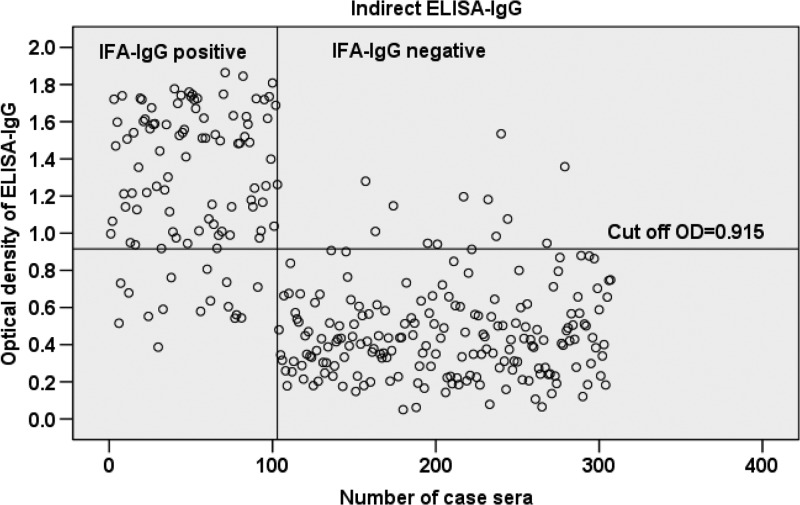
Figure 1.
Scatterplot analysis of 302 sera measured by enzyme-linked immunosorbent assay (ELISA)-immunoglobulin G (IgG) using rPap31 antigen. The vertical line separates immunofluorescent assay (IFA)-IgG-positive sera (sera nos. 1 to 103) from negative sera (sera nos. 104 to 302). The horizontal line indicates the cutoff value of the ELISA-IgG assay.

