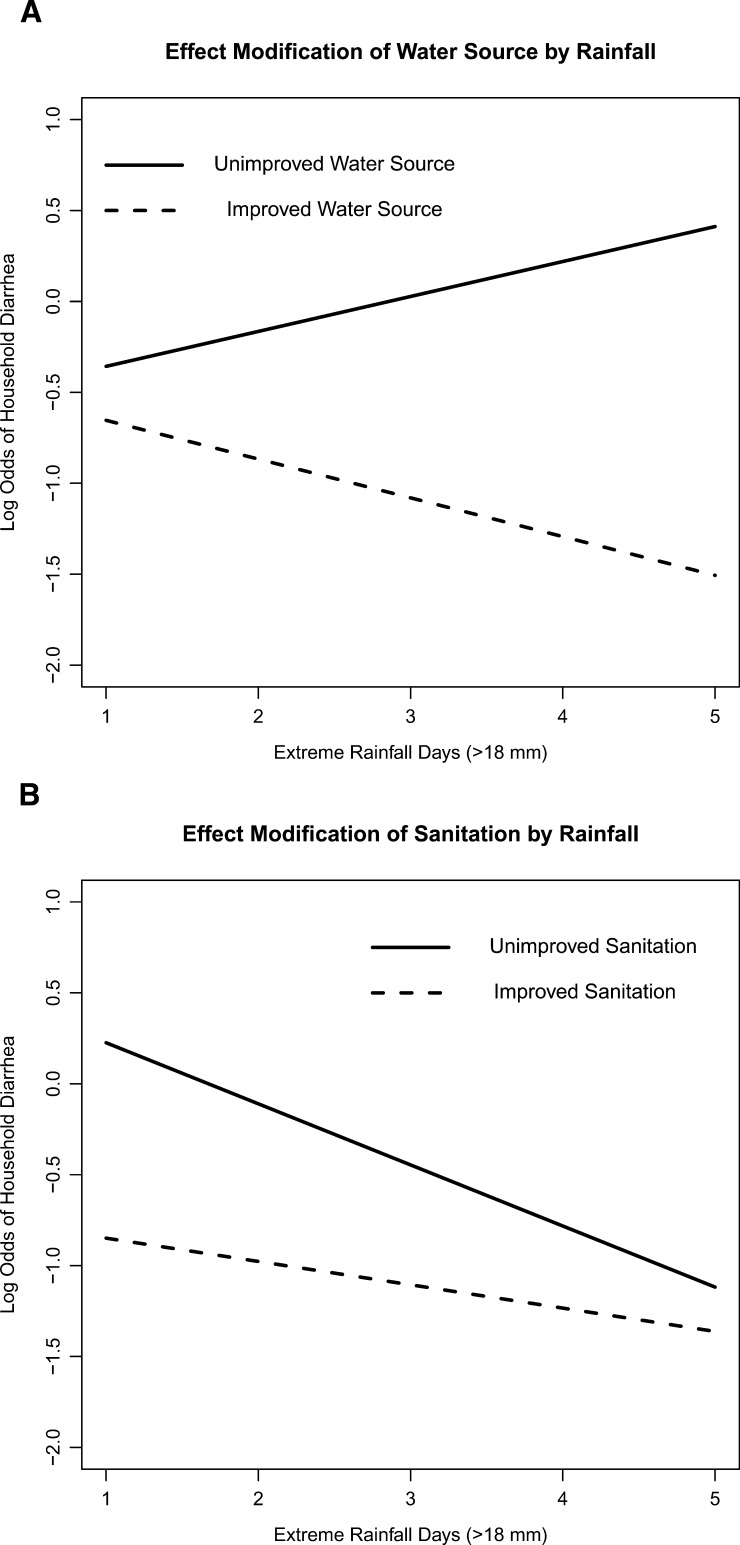
Figure 2.
(A) The predicted probability of household diarrhea on the log odds scale (y axis) for a household with median household size and ownership, at least one child under the age of 5 years, improved sanitation, and either an improved (dashed line) or unimproved (solid line) water source at each value of extreme rainfall days in the 5 weeks before the end of the 15-day case control period in Borbón, Ecuador (from December of 2008 to May of 2009). (B) The predicted probability of household diarrhea on the log odds scale (y axis) for a household with median household size and ownership, at least one child under the age of 5 years, an improved water source, and either improved (dashed line) or unimproved (solid line) sanitation at each value of extreme rainfall days (x axis) in the 5 weeks before the end of the 15-day case control period in Borbón, Ecuador (from December of 2008 to May of 2009).

