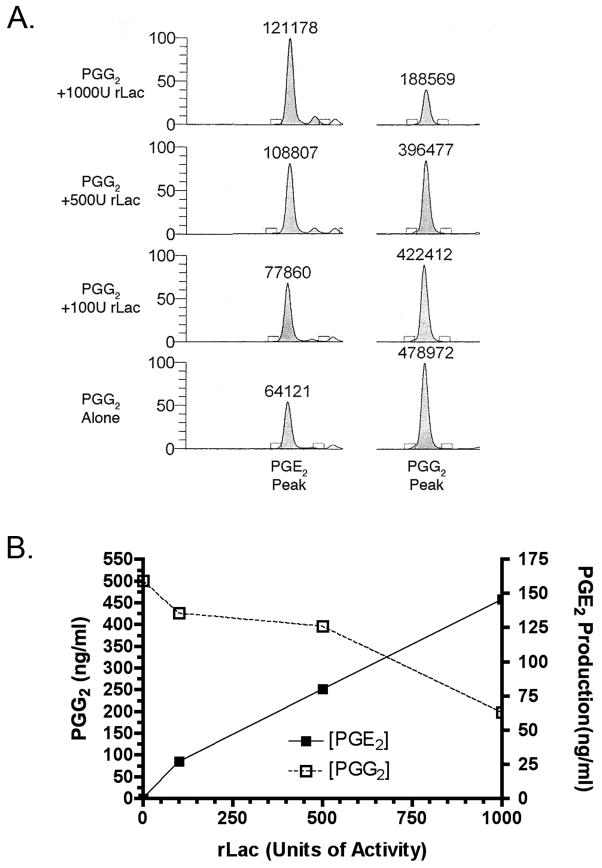
Figure 4. The effect of recombinant Lac1 on PGG2 to PGE2 conversion.
Increasing concentrations of rLac1 were incubated with PGG2, and the products were separated and analyzed using LC-MS as described in Materials and Methods. Panel A is the extracted ion chromatograms of PGE2 (m/z range = 351–352 [M–H]− ion) and PGG2 (m/z range = 367–368 [M–H]− ion) with increasing concentrations of rLac1. The numbers above each peak denote the area under the peak. Panel B demonstrates the increase in PGE2 production over background levels and the decrease in PGG2.

