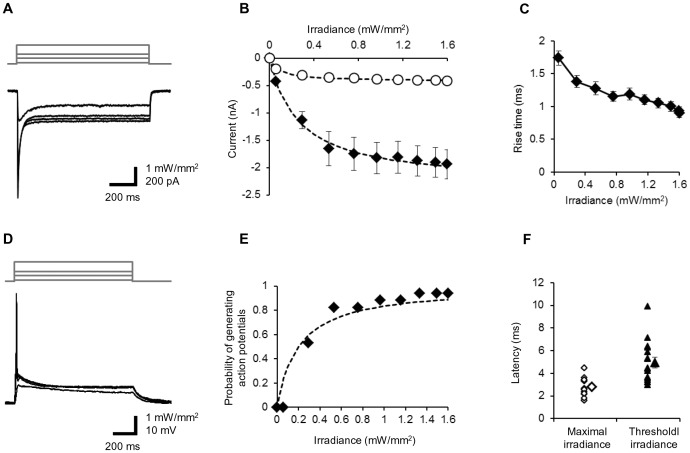
Figure 3. Optical responses of the ChR2V+ TG neurons.
A, Representative records of photocurrents (bottom) evoked by blue LED light of variable strength (top) under voltage clamp. B, The peak (closed diamonds) and the steady-state (open circles) photocurrent amplitudes as functions of the light power density. Each point with bar indicates mean ± SEM and is fitted to a Michaelis-Menten-type kinetics, y = Imax x / (x + Km); Imax = −2.3 nA (peak) and 0.42 nA (steady state), respectively, and Km = 0.26 mWmm−2 (peak) and 0.085 mWmm−2 (steady state), respectively. C, The time between the onset of LED pulse and the minimal rate of rise of ChR2 photocurrent was measured as the rise time and plotted as a function of irradiance (mean ± SEM, n = 29). D, Representative records of the neuronal membrane potential evoked by blue LED pulses (200 ms) of variable strength under current clamp. The resting membrane potential, −56 mV. E, The probability of generating action potentials as a function of the irradiance (n = 14). Each point with bar indicates mean ± SEM and is fitted to a Michaelis-Menten-type relationship, y = x / (x + Km) where Km = 0.20 mWmm−2. F, The time between the onset of the LED pulse and the maximal rate of rise of action potential was measured as the action potential rise time and plotted for both responses to the maximal irradiance (open diamonds, n = 16) and the threshold irradiance (closed triangles, n = 16). The larger symbols represent mean ± SEM.

